Syn sent which means. Description of the NETSTAT command (statistics for active TCP connections)
Laboratory work No. 03-005
The netstat network utility. Principles of operation and use.
The utility displays active and listening TCP ports, Ethernet statistics, IP routing tables, IPv4 statistics (for IP, ICMP, TCP and UDP) and IPv6 (for IPv6, ICMPv6, TCP over IPv6 and UDP over IPv6). Run without parameters, command netstat displays active TCP connections.
Syntax:
netstat [-a] [-e] [-n] [-o] [-p protocol] [-r] [-s] [interval].
Parameters:
-a List all active TCP connections and TCP and UDP ports on the computer.
- b displaying executable files involved in creating active connections. If independent software components are used to create the socket, they are also displayed.
-e displays Ethernet statistics such as the number of bytes and packets sent and received. This parameter can be combined with the key -s;
-ndisplaying active TCP connections with displaying addresses and port numbers in numerical format without trying to determine names;
-o display active TCP connections and include a process ID (PID) for each connection. The process code allows you to find the application in the tab Processes Windows Task Manager. This parameter can be combined with keys -a, -n and -p;
-p protocol output connections for the protocol specified by the parameter protocol... In this case, the parameter protocol can take values tcp, udp, tcpv6 or udpv6... If this parameter is used with the key -s to display statistics on the protocol, parameter protocol may matter tcp, udp, icmp, ip, tcpv6, udpv6, icmpv6 or ipv6;
-rdisplay the contents of the IP routing table. This command is equivalent to the command route print;
-soutput of statistics by protocol. By default, statistics are displayed for TCP, UDP, ICMP and IP protocols. If IPv6 is installed for Windows XP, statistics are displayed for TCP over IPv6, UDP over IPv6, ICMPv6, and IPv6. Parameter -p can be used to specify a set of protocols;
- vused together with the parameter – b to display the sequence of software components involved in creating a socket
interval sets the update of the selected data at an interval determined by the parameter interval (in seconds). Pressing CTRL + C stops the update. If this parameter is omitted, netstat outputs the selected data only once.
/? aboutdisplay help on the command line.
At the network layer in the TCP / IP protocol stack, addressing is performed using IP addresses. But after the packet is delivered by means of the IP protocol to the recipient computer with the specified IP address, the data must be sent to a specific recipient application process. Each computer can execute several processes, moreover, an application process can have several entry points that simultaneously act as recipients of data.
The communication needs of application processes are serviced by the transport layer of the protocol stack, implemented programmatically in the operating system kernel, in the form of a separate user process or in the form of a library module loaded by a network application. Packages arriving at the transport layer are organized by the operating system in the form of multiple queues to the entry points of various application processes. In TCP / IP terminology, these system queues are called ports . Port is a software concept used by a client or server to send or receive messages; the port is identified by a 16-bit number. Thus, the destination address used by the transport object is the port identifier (number) of the application service. The port number, in conjunction with the network number and endpoint number, uniquely identify the application on the network. This set of identifying parameters is called socket .
Port numbers are assigned to application processes either centrallyif these processes are popular public services (for example, 21 is assigned to the FTP remote file access service, and 23 to the telnet remote control service), or locally for those services that are not yet widespread enough to be assigned to them standard (reserved) rooms. The centralized assignment of port numbers to services is done by the organization Internet Assigned Numbers Authority (IANA)... These numbers are then fixed and published in Internet standards.
Local port number assignment means that the developer of an application simply associates with it any available, randomly chosen numeric identifier, making sure that it is not among the reserved port numbers. In the future, all remote requests to this application from other applications should be addressed with the specified port number assigned to it.
The client initiating the connection, before attempting to establish a connection with the remote application server, asks its OS for a free port number. Ports with numbers 0-1023 are usually called privileged, they are almost all reserved and are not allocated to client processes. This does not mean that there are no fixed port numbers with large numbers, but they are used much less often and, being free on a given host, may well be made available to the client program.
UDP (UserDatagrammProtocol) is a simple datagram-oriented transport layer protocol: the process issues one UDP datagram at a time, resulting in one IP datagram being transmitted. The protocol does not establish connections and does not confirm to the sender that the message was delivered.
TCP (Transmission Control Protocol) provides a connection-based reliable byte stream service. It is used when guaranteed message delivery is required. It uses packet checksums to verify packet integrity and frees application processes from the need for timeouts and retransmissions to ensure reliability.
The term "connection-oriented" means that two applications using TCP (usually a client and a server) must establish a TCP connection with each other, after which they can exchange data.
There are always two endpoints that communicate with each other using a TCP connection. TCP does not broadcast or multicast.
The steps required to establish and terminate a TCP connection can be
lens in the form of a model with 11 possible states:
Status Description
CLOSED Closed. The connection is not active and is not in the process of installation
LISTEN Waiting. The server is waiting for an incoming request
SYN RCVD A connection request has arrived. Waiting for confirmation
SYN SENT A connection request was sent. Application started to open connection
ESTABLISHED Installed. Normal data transfer state
FINWAIT 1 Application reported that it has nothing more to transfer
FINWAIT 2 The other party agrees to terminate the connection
TIMED WAIT Waiting for all packets to disappear from the network
CLOSING Both sides tried to close the connection at the same time
CLOSE WAIT The other party initiated a disconnect
LAST ACK Waiting until all packets disappear from the network
In each of these states, allowed and forbidden events can occur. In response to any permitted event, a specific action can be taken. An error is reported when prohibited events occur.
Each connection starts in a state CLOSED(closed). It can exit this state by either active (CONNECT) or passive (LISTEN) attempts to open a connection. If the opposite side performs opposite actions, the connection is established and transitions to the state ESTABLISHED.Any party can initiate a disconnection. Upon completion of the disconnect process, the connection returns to the state CLOSED.
Self-test questions
Port as a transport layer addressing element. Socket.
Locally and centrally assigned ports.
Basic transport protocols of the TCP / IP stack. Their brief description.
Mapping network connections to processes running on the computer.
The parameters of the netstat utility.
Necessary equipment
IBM PC - a compatible computer with a licensed Windows operating system, connection to a local network, Internet access.
Tasks
Restart your computer and do not start any applications before starting tasks.
1. Use the netstat command to view the statistics for the Ethernet connection.
2. Use the netstat command to view the statistics of the network protocols.
3. Using the netstat command, view the statistics of the ICMP protocol (the output should contain data only for this protocol).
4. Use the netstat command to view a list of all TCP connections and listening UDP ports.
5. Launch your browser and connect to any site. Repeat the previous task and comment on the result.
6. Use the netstat command to identify any 5 processes listening on UDP ports. Specify the name of the processes and the numbers of the listening ports.
6. Use the netstat command to determine the active TCP connections, their port numbers, and the names of the executable files of the applications using these connections.
Submit the work progress report in hard copy or electronic form with copies of the utility operation screens.
The Netstat command displays various network data such as network connections, routing table, interface statistics, masked connections, multicast space, etc.
In this article, let's take a look at 10 practical command examples NetStat on Unix.
1. List of all ports (both listening and non-listening ports)
List all ports using Netstat -a command
# netstat -a | more Active Internet connections (servers and established) Proto Recv-Q Send-Q Local Address Foreign Address State tcp 0 0 localhost: 30037 *: * LISTEN udp 0 0 *: bootpc *: * Active UNIX domain sockets (servers and established) Proto RefCnt Flags Type State I-Node Path unix 2 [ACC] STREAM LISTENING 6135 /tmp/.X11-unix/X0 unix 2 [ACC] STREAM LISTENING 5140 /var/run/acpid.socketList all TCP ports using netstat -at
# netstat -at Active Internet connections (servers and established) Proto Recv-Q Send-Q Local Address Foreign Address State tcp 0 0 0.0.0.0:http 0.0.0.0:* LISTEN tcp 0 0 localhost: webcache 0.0.0..0.0 .0: * LISTEN tcp 0 0 localhost: domain 0.0.0.0:* LISTENListing all UDP ports with netstat -au
# netstat -au Active Internet connections (servers and established) Proto Recv-Q Send-Q Local Address Foreign Address State udp 0 0 andreyex..ru: 50053 google-public-dn: domain ESTABLISHED2. List of sockets that are listening
List only listening ports with netstat -l
# netstat -l Active Internet connections (only servers) Proto Recv-Q Send-Q Local Address Foreign Address State tcp 0 0 0.0.0.0:http 0.0.0.0:* LISTEN tcp 0 0 localhost: webcache 0.0.0..0.0. 0: * LISTEN tcp 0 0 localhost: domain 0.0.0.0:* LISTENList only listening TCP ports with netstat -lt
# netstat -lt Active Internet connections (only servers) Proto Recv-Q Send-Q Local Address Foreign Address State tcp 0 0 0.0.0.0:http 0.0.0.0:* LISTEN tcp 0 0 localhost: webcache 0.0.0..0.0. 0: * LISTEN tcp 0 0 localhost: domain 0.0.0.0:* LISTENList only listening UDP ports using netstat -lu
# netstat -lu Active Internet connections (only servers) Proto Recv-Q Send-Q Local Address Foreign Address State udp 0 0 site: domain 0.0.0.0:* udp 0 0 localhost: domain 0.0.0..0.0.0: *List only listening UNIX ports with netstat -lx
# netstat -lx Active UNIX domain sockets (only servers) Proto RefCnt Flags Type State I-Node Path unix 2 [ACC] STREAM LISTENING 19693 tmp / core.adm.internal unix 2 [ACC] SEQPACKET LISTENING 8723 / run / udev / control unix 2 [ACC] STREAM LISTENING 12566 / var / run / dbus / system_bus_socket unix 2 [ACC] STREAM LISTENING 16948 /var/run/fail2ban/fail2ban.sock unix 2 [ACC] STREAM LISTENING 19702 tmp / core.sock3. Show statistics for each protocol
Show statistics for all ports using netstat -s
# netstat -s Ip: 190566 total packets received 0 forwarded 0 incoming packets discarded 189618 incoming packets delivered 170462 requests sent out 16 dropped because of missing route Icmp: 74 ICMP messages received 0 input ICMP message failed. ICMP input histogram: destination unreachable: 22 echo requests: 52 .....Show statistics for TCP (or) UDP ports using netstat -st (or) -su
# netstat -st # netstat -su4. PIDs and program names in netstat output using netstat -p command
Option netstat -p can be combined with any other option netstat... This will add "PID / Program Name" to the output netstat... This is very useful when debugging to determine which program is running on a specific port.
# netstat -pt Active Internet connections (w / o servers) Proto Recv-Q Send-Q Local Address Foreign Address State PID / Program name tcp 0 0 localhost: 56642 localhost: 46846 TIME_WAIT - tcp 0 0 localhost: 56642 localhost: 46748 TIME_WAIT -
5. Don't allow host, port and username in netstat output
If you don't want to display the hostname, port, or user, use netstat with the -n option. It will display in numbers, and not allow hostname, portname, username.
This also speeds up the logout as netstat does not perform any lookups.
# netstat -an
If you don't want one of these three items (port or host or user), use the following commands.
# netsat -a --numeric-ports # netsat -a --numeric-hosts # netsat -a --numeric-users
6. Continuous printing of netstat information
netstat will print information continuously every few seconds.
132.93.178: 24080 ESTABLISHED tcp 0 0 localhost: 56642 localhost: 47258 TIME_WAIT tcp 0 0 localhost: 56642 localhost: 47150 TIME_WAIT ^ C
Exit printing: Ctrl + C.
7. Find numbers supporting the address of families in your system
netstat --verboseIn the end, you will have something like this.
Netstat: no support for ʻAF IPX "on this system. Netstat: no support for ʻAF AX25" on this system. netstat: no support for ʻAF X25 "on this system. netstat: no support for ʻAF NETROM" on this system.
8. Displaying kernel routing information using netstat -r
# netstat -r Kernel IP routing table Destination Gateway Genmask Flags MSS Window irtt Iface default gw.msk.ispsyste 0.0.0.0 UG 0 0 0 eth0 213.159.208.0 0.0.0.0 255.255.254.0 U 0 0 0 eth0Note:
Use netstat -rn to display routes digitally without hostname resolution.
9. Find out on which port the program is running
# netstat -ap | grep ssh (Not all processes could be identified, non-owned process info will not be shown, you would have to be root to see it all.) tcp 0 0 0.0.0.0:28456 0.0.0..132.93..132.93. 178: 13106 ESTABLISHED 2393 / sshd: andreyex tcp6 0 0 [::]: 28456 [::]: * LISTEN 779 / sshdFind out which process is using a specific port:
# netstat -an | grep ": 80"
10. Show list of network interfaces
# netstat -i Kernel Interface table Iface MTU RX-OK RX-ERR RX-DRP RX-OVR TX-OK TX-ERR TX-DRP TX-OVR Flg eth0 1555 2765202 0 0 0 86602 0 0 0 BMRU lo 65536 93149 0 0 0 93149 0 0 0 LRUDisplaying extended information about interfaces (similar to ifconfig) using netstat -ie:
# netstat -ie Kernel Interface table eth0: flags \u003d 4163
Hello everyone, earlier I started a story about the system administrator's network utilities in the article "Pathping utility or how to diagnose a problem on the route to the site. Network utilities part 3", move on and disassemble one more utility netstat or how to determine which ports your computer is listening on. This program will be an irreplaceable tool in the luggage of software, any system engineer, will help him to quickly diagnose the situation and detect a number of all kinds of problems with services and their availability.
Netstat Commands
Netstat - Displays active TCP connections, ports the computer is listening to, Ethernet statistics, IP routing table, IPv4 statistics (for IP, ICMP, TCP and UDP) and IPv6 (for IPv6, ICMPv6, TCP over IPv6 and UDP over IPv6)
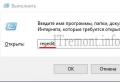
Imagine a situation you installed, for example, the MSM LSI utility to view the parameters of the RAID controller, run the utility, but it does not find anything, because the port is closed and which one you do not know, and it is not always possible to quickly find information about this on the Internet, for this you and can run netstat and see what port your server with the MSM process is listening on.
Open the Windows command line and enter netstat ?. The utility help will pop up.

C: \\ Users \\ sem\u003e netstat?
Displays protocol statistics and current TCP / IP network connections.
NETSTAT [-a] [-b] [-e] [-f] [-n] [-o] [-p protocol] [-r] [-s] [-x] [-t]
[interval]
- -a Displays all connections and listening ports.
- -b Display the executable involved in the creation
- each connection or listening port. Sometimes known executable files contain many independent components. The sequence of components involved in creating the connection or listening port is then displayed. In this case, the name of the executable file is at the bottom in parentheses, at the top is the component it called, and so on until TCP / IP is reached. Note that this approach can be time consuming and requires sufficient permissions.
- -e Display Ethernet statistics. Can be used in conjunction with the -s option.
- -f Display fully qualified domain name () for external addresses.
- -n Display addresses and port numbers in numeric format.
- -o Displays the process ID of each connection.
- -p protocol Displays the connections for the protocol specified by this parameter. Valid values \u200b\u200bare TCP, UDP, TCPv6, or UDPv6. When used in conjunction with the -s option to display protocol statistics, the valid values \u200b\u200bare IP, IPv6, ICMP, ICMPv6, TCP, TCPv6, UDP, or UDPv6.
- -r Display the contents of the route table.
- -s Show statistics by protocol. By default, statistics are displayed for IP, IPv6, ICMP, ICMPv6, TCP, TCPv6, UDP, and UDPv6 protocols. The -p option lets you specify a subset of the output.
- -t Show offload status for the current connection.
- -x Displays NetworkDirect connections, listeners, and shared endpoints.
- -y Display the TCP connection pattern for all connections. Cannot be used in conjunction with other parameters. interval Re-display the selected statistics with a pause between displays specified by the interval in seconds. To stop redisplaying statistics, press CTRL + C. If this parameter is omitted, netstat will print the current configuration information once.
Let's take a look at some interesting options for the netstat utility. The first thing we enter
and the statistics of ethernet network packets will appear on the screen.

If we add the -s switch, we get statistics on protocols.


It is very useful to see everything that your host is listening to, for this we write
The output of the command contains the Type of protocol, either TCP or UDP, the local address with the port that is being listened to, and the external address with the port and the action state.
To fully understand the information provided by this command, it is necessary to understand the principles of establishing a TCP / IP connection. Here are the main steps in the process of establishing a TCP / IP connection:
1. When trying to establish a connection, the client sends a SYN message to the server.
2. The server responds with its own SYN and acknowledgment (ACK) message.
3. The client then sends an ACK message back to the server, completing the connection setup process.
The disconnection process consists of the following steps:
1. The client reports "I am done" by sending a FIN message to the server. At this stage, the client only receives data from the server, but does not send anything itself.
2. The server then sends an ACK message and sends its own FIN message to the client.
3. The client then sends an ACK message to the server, acknowledging the FIN request from the server.
4. Upon receiving an ACK message from the client, the server closes the connection.
Understanding the steps involved in establishing and breaking a connection allows you to more transparently interpret the connection states in the netstat output. The connections in the list can be in the following states.
- CLOSE_WAIT - indicates the passive phase of closing the connection, which begins after the server receives a FIN message from the client.
- CLOSED - the connection was interrupted and closed by the server.
- ESTABLISHED - the client has established a connection to the server, having received a SYN message from the server.
- FIN_WAIT_1 - the client initiated the closure of the connection (sent a FIN message).
- FIN_WAIT_2 - the client received ACK and FIN messages from the server.
- LAST_ACK - the server sent a FIN message to the client.
- LISTEN - the server is ready to accept incoming connections.
- SYN_RECEIVED - the server received a SYN message from the client and sent a response to it.
- TIMED_WAIT - the client has sent a FIN message to the server and is waiting for a response to this message.
- YN_SEND - the specified connection is active and open.

If you add the -f switch, the names of remote external resources will be resolved

& nbsp & nbsp Team NETSTAT is designed to obtain information about the state of network connections and listened to on this computer TCP and UDP ports, as well as to display statistical data on network interfaces and protocols.
Command line format:
NETSTAT [-a] [-b] [-e] [-f] [-n] [-o] [-p protocol] [-r] [-s] [-t] [interval]
Command line parameters:
-a - Displays all connections and pending ports.
-b - Displays the executable file involved in the creation of each connection, or the waiting port. Sometimes known executable files contain multiple independent components. Then the sequence of components participating in the creation of the connection or the waiting port is displayed. In this case, the name of the executable file is at the bottom in parentheses, at the top is the component that it calls, and so on until TCP / IP is reached. Note that this approach can be time consuming and requires sufficient permissions.
-e - Display of Ethernet statistics. Can be used in conjunction with the -s option.
-f - Displays the fully qualified domain name (FQDN) for external addresses.
-n - Display addresses and port numbers in numerical format.
-o - Displays the code (ID) of the process of each connection.
-p protocol - Displays the connections for the protocol specified by this parameter. Valid values \u200b\u200bare TCP, UDP, TCPv6, or UDPv6. Used in conjunction with the -s option to display protocol statistics. Valid values \u200b\u200bare IP, IPv6, ICMP, ICMPv6, TCP, TCPv6, UDP, or UDPv6.
-r - Displays the contents of the route table.
-s - Display of protocol statistics. By default, statistics are displayed for IP, IPv6, ICMP, ICMPv6, TCP, TCPv6, UDP, and UDPv6 protocols. The -p option lets you specify a subset of the output.
-t - Display of the current connection in the state of transferring the load from the processor to the network adapter during data transfer ("offload").
-v - Detailed output of information, if possible.
interval - Repeated display of statistical data at a specified interval in seconds. Press CTRL + C to stop outputting data. If the parameter is not specified, information about the current configuration is displayed once.
In practice, the utility netstat.exe convenient to use in a chain with paging commands ( more), redirecting standard output to a file ( > ) and search for text in the output results ( find).
netstat -a | more - display all connections in a page-by-page display mode.
netstat -a -n | more - same as in the previous example, but displaying port numbers and IP addresses in numerical format. Unlike the previous example, the command netstat with parameter -t works much faster.
netstat -a -f | more - the same as in the previous example, but with displaying the full DNS names of the hosts participating in the connection.
netstat -a\u003e C: \\ netstatall.txt - display all connections with writing results to the file C: \\ netstatall.txt.
netstat -a | find / I "LISTENING" - display all connections with the LISTENING status, i.e. display a list of network interfaces and ports waiting for incoming connections ("listening" ports). Key / I in a team find indicates that when searching for text, you do not need to be case sensitive.
netstat -a | find / I "listening"\u003e C: \\ listening.txt - display all connections with the LISTENING status with the results being written to the file C: \\ listening.txt.
An example of displayed information:
Active connections
Name - the name of the protocol.
Local address - the local IP address participating in the connection or associated with a service that is waiting for incoming connections (listening on a port). If 0.0.0.0 is displayed as an address, it means "any address", that is, all IP addresses existing on this computer can be used in the connection. The address 127.0.0.1 is a loopback interface used as an IP protocol vehicle for inter-process communication without actually transferring data.
External address External IP address involved in creating the connection.
condition - connection state. condition Listening indicates that the status bar displays information about the network service waiting for incoming connections over the corresponding protocol to the address and port displayed in the "Local address" column. condition ESTABLISHED indicates an active connection. The "Status" column for TCP connections can display the current stage of the TCP session, which is determined by the processing of flag values \u200b\u200bin the TCP packet header (Syn, Ask, Fin ...). Possible states:
CLOSE_WAIT - waiting for the connection to close.
CLOSED - the connection is closed.
ESTABLISHED - connection established.
LISTENING - connection is awaiting (port is listening)
TIME_WAIT - exceeding the response time.
The name of the program unit associated with this connection is displayed if the parameter -b at the command prompt when you run netstat.exe.
netstat -a -b - get a list of all network connections and related programs.
TCP 192.168.0.3:3389 89.22.52.11:5779 ESTABLISHED
CryptSvc
This example displays information about a connection that software components are involved in. CryptSvc and svchost.exe.
netstat -ab - command line parameters can be combined. Parameter -ab equivalent -a -b
netstat -e - get statistical data for the exchange via the Ethernet protocol. Displays the total bytes received and received for all Ethernet network adapters.
Interface statistics
netstat -e -v - in addition to summary statistics, information about data exchange through individual network interfaces is displayed.
netstat -e -s - in addition to Ethernet statistics, statistics for IP, ICMP, TCP, UDP protocols are displayed
Interface statistics
IPv4 statistics
| Packets received Received errors in headers Received errors in addresses Sent datagrams Dropped received packets Withdrawal requests Discarded routes Discarded output packets Assembly required Successful build Build failures Fragments created |
= 10877781 = 0 = 27307 = 0 = 0 = 448 = 11384479 = 11919871 = 0 = 1517 = 6 = 0 = 0 = 0 = 5918 = 0 = 11836 |
IPv6 statistics
| Packets received Received errors in headers Received errors in addresses Sent datagrams Received unknown protocols Dropped received packets Received packages delivered Withdrawal requests Discarded routes Discarded output packets Output packets without a route Assembly required Successful build Build failures Successfully fragmented datagrams Datagram fragmentation crashes Fragments created |
= 0 = 0 = 0 = 0 = 0 = 0 = 391 = 921 = 0 = 0 = 14 = 0 = 0 = 0 = 0 = 0 = 0 |
ICMPv4 statistics
ICMPv6 Statistics
TCP statistics for IPv4
TCP statistics for IPv6
UDP Statistics for IPv4
UDP Statistics for IPv6
netstat -s -p icmp - get statistics only via ICMP protocol
An example of the displayed statistics:
ICMPv4 statistics
To cyclically poll the status of network connections, the program is launched with an indication of the interval for outputting statistical data in seconds.
netstat -e 3 - display statistics over Ethernet with an interval of 3 seconds.
netstat –f 10 - every 10 seconds display statistics of network connections using full DNS hostnames.
netstat -n 5 | find / i "Established" - every 5 seconds display statistics on established connections.
Regularly, some for diagnostic purposes only. I belong to the latter category: I prefer to use this utility to identify the causes of system problems and problems.
The netstat command has ten parameters that provide detailed information for a wide variety of tasks. However, no less useful information can be obtained without any parameters.
Most often, netstat is used with the -a option to get a list of all connections and listening ports. Listed below are a few other parameters that may come in handy when using this utility.
Fully qualified domain name. The -f option lets you find out the FQDN for the external address. When using netstat with this parameter, names are resolved on both internal and external networks. In fig. A shows the output of the command.
Figure A
Which process is using this or that port. The -a -n -o options can be used to find out which process identifier (PID) a particular port corresponds to. (See) The command output is shown in Fig. B.

Figure B
And if you add the -b parameter to this combination, friendly names will be used for each process, as shown in Fig. C. However, this requires administrator rights.

Figure C
Note: remote addresses pointing to 192.168.1.220:3261 belong to the Windows iSCSI Initiator service and are designated differently from other services.
Displaying the routing table. When you need to find out why a network connection works differently on one computer than on others on the same network, you can use the -r parameter, which displays the route for a given system, as shown in Figure 1. D. Note the Persistent routes section, which lists all the static routes configured for Windows Server.

Figure D
These four variations of the netstat command make