In the idef0 methodology, the top level of the model is called. Rules for constructing diagrams IDEF0. Semantics of the IDEF0 language
R 50.1.028-2001
Information technology support life cycle products
FUNCTIONAL MODELING METHODOLOGY
Continuous acquisition and life-cycle support.
Methodology of functional modeling
OKS 25.040.40
Date of introduction 2002-07-01
Foreword
1 DEVELOPED by the Research Center of CALS-Technologies "Applied Logistics" with the participation of the All-Russian Research Institute of Standardization (VNIIstandart)
INTRODUCED by the Technical Committee for Standardization TC 431 "CALS Technologies"
3 INTRODUCED FOR THE FIRST TIME
Introduction
The constant complication of production-technical and organizational-economic systems - firms, enterprises, industries and other subjects of production and economic activity - and the need for their analysis in order to improve the functioning and increase efficiency necessitate the use of special means of describing and analyzing such systems. This problem is of particular relevance in connection with the emergence of integrated computerized production and automated enterprises.
In the United States at the end of the 70s, the ICAM (Integrated Computer Aided Manufacturing) program was proposed and implemented, aimed at increasing the efficiency of industrial enterprises through the widespread introduction of computer (information) technologies.
The implementation of the ICAM program required the creation of adequate methods for the analysis and design of production systems and ways of exchanging information between specialists dealing with such problems. To meet this need, within the framework of the ICAM program, the IDEF (ICAM Definition) modeling methodology was developed, which allows to study the structure, parameters and characteristics of production-technical and organizational-economic systems. The general IDEF methodology consists of three particular modeling methodologies based on graphical representations of systems:
IDEF0 is used to create a functional model that displays the structure and functions of the system, as well as the flows of information and material objects that are transformed by these functions;
IDEF1 is used to build an information model that displays the structure and content of information flows necessary to support the system's functions;
IDEF2 allows you to build a dynamic model of the time-varying behavior of functions, information and system resources.
To date, the most widespread and applied methodologies are IDEF0 and IDEF1 (IDEF1X).
The IDEF0 methodology, the features and applications of which are described in these recommendations, is based on an approach called SADT (Structured Analysis & Design Technique). The basis of this approach and the IDEF0 methodology is a graphical language for describing (modeling) systems.
In connection with the expanding application of information technologies and, in particular, CALS technologies in the national economy of the Russian Federation, these recommendations provide basic information about the IDEF0 methodology and the graphical language for describing models, as well as practical instructions on how to develop such models.
1 area of \u200b\u200buse
These recommendations for standardization are intended for use in the analysis and synthesis of production-technical and organizational-economic systems by methods of functional modeling in various sectors of the economy. The recommendations contain a description of a set of tools for visualizing a wide range of business, production and other processes and operations of an enterprise at any level of detail, as well as organizational and methodological techniques for using these tools.
2.1 block: A rectangle containing a name and number and used to describe a function.
2.2 branching: The division of an arrow into two or more segments. May mean "unbundling" (see 2.27).
2.3 inner arrow: An input, control or output arrow, the ends of which connect the source and the consumer, which are blocks of the same diagram. Differs from the boundary arrow.
2.4 input arrow: A class of arrows representing the input of an IDEF0 block, that is, data or material objects that are converted by a function to an output. Input arrows connect to the left side of the IDEF0 block.
2.5 output arrow: A class of arrows representing the output of an IDEF0 block, that is, data or material objects produced by a function. The output arrows are connected to the right side of the IDEF0 block.
2.6 glossary: \u200b\u200bList of definitions for keywords, phrases and abbreviations associated with nodes, blocks, arrows or with the IDEF0 model in general.
2.7 boundary arrow: An arrow, one of the ends of which is associated with a source or consumer, and the other is not attached to any block in the diagram. Shows the connection of the diagram with other blocks of the system and differs from the inner arrow.
2.9 node tree: Representation of the relationship between parent and child nodes of the IDEF0 model in the form of a tree graph. Has the same meaning and content as the list of nodes (see 2.23).
2.10 A-0 diagram (A minus zero): A special kind of (context) IDEF0 diagram, consisting of one block, describing the top-level function, its inputs, outputs, control, and mechanisms, together with the statement of the purpose of the model and the point of view from which the model is being built.
2.11 diagram: The part of the model describing block decomposition.
2.12 illustration diagram (FEO): A graphical description used to communicate specific facts about an IDEF0 diagram. When constructing FEO diagrams, you do not have to adhere to IDEF0 rules.
2.13 child block: A block on a child (child) diagram.
2.14 child diagram: A diagram detailing the parent (parent) block
2.15 block name: A verb or verb turnover placed inside a block and describing the function being modeled.
2.16 interfacedividing boundary through which data or material objects pass; a connection between two or more model components that transfers data or material objects from one component to another.
2.17 ICOM code (abbreviation Input - input, Control - control, Output - output, Mechanism - mechanism): The code that ensures the correspondence of the boundary arrows of the child diagram with the arrows of the parent block; used for links.
2.18 contextenvironment in which a function (or set of functions in a diagram) operates
2.19 context diagram: A diagram with a nodal number A- (A minus) () that represents the context of the model. Diagram A-0, consisting of one block, is a necessary (mandatory) context diagram; diagrams with nodal numbers A-1, A-2, (A minus 1, A minus 2) +, - additional context diagrams.
2.20 arrow mark: A noun or noun phrase associated with an arrow or arrow segment and defining its meaning.
2.21 IDEF0 model: A graphical description of a system designed for a specific purpose (see 2.46) and from a chosen point of view (see 2.39). A set of IDEF0 documents that depict the functions of the system using graphics (diagrams), text and a glossary.
2.22 block number: A number (0-6) placed in the lower right corner of the block and uniquely identifying the block in the diagram.
2.23 node list: A list, often stepped, showing the nodes of the IDEF0 model in an ordered manner. Has the same meaning and content as the node tree (see 2.9).
2.24 model note: A textual comment that is part of the IDEF0 diagram and is used to record a fact that has not found a graphic image.
2.25 parent diagram: A diagram that contains a parent block.
2.26 parent block: A block that is described in detail by a child diagram.
2.27 bind / unbind: The concatenation of arrow values \u200b\u200binto a composite value (bind into a "bundle"), or the separation of arrow values \u200b\u200b(unbind a "bundle"), expressed in the syntax of fusion or branch arrows.
2.28 arrow segment: A line segment that starts or ends at the side of a block, at a branch or merge point, or at a boundary (unconnected arrow end).
2.29 semantics: The meaning of the syntactic components of a language.
2.30 syntax: Structural components or characteristics of a language and rules that define the relationship between them.
2.31 merge: Combining two or more arrow segments into one segment. May mean "bundle bundle" (see 2.27).
2.32 C-number: A number generated in chronological order and used to identify a diagram and trace its history; can be used as a reference expression when defining a specific version of a diagram. Typically, the C-number consists of the initials of the model author and historical data (the date the next version of the chart was created).
2.33 arrow: A directed line, consisting of one or more segments, that simulates an open channel or channel that transfers data or material objects from the source (starting point of the arrow) to the consumer (end point with a "tip"). There are four classes of arrows: input, output, control arrow of the mechanism (includes a call arrow). (See arrow segment, bounding arrow, inner arrow).
2.34 call arrow: A view of a mechanism arrow that indicates a call from a block of a given model (or part of a model) to a block of another model (or another part of the same model) and provides a link between models or between different parts of one model.
2.35 mechanism arrow: A class of arrows that represent IDEF0 mechanisms, that is, the means used to perform a function; includes a special call arrow case. Mechanism arrows communicate with the underside of the IDEF0 block.
2.36 arrow placed in a tunnel (tunnel arrow): An arrow (with special notation) that does not satisfy the usual requirement that each arrow in a child diagram must correspond to arrows in the parent diagram. Tunnel arrows are an additional graphical language feature that makes diagrams easier to read and understand.
2.37 text: Any textual (non-graphic) comment on an IDEF0 graphic diagram.
2.38 tilde: A small broken (wavy) line used to connect a label to a specific arrow segment or model note to a diagram component.
2.39 point of view: An indication of the official or department of the organization from whose position the model is developed. There is only one point of view for each model.
2.40 node: A block that spawns child blocks; parent block. (See node list, node tree, node number, node reference, diagram node number).
2.42 chart nodal number: The portion of a chart nodal reference that corresponds to the parent block number.
2.43 nodal number: A code assigned to a block and determining its position in the model hierarchy; can be used as a detailed reference expression.
2.44 control arrow: A class of arrows, which in IDEF0 represent controls, that is, conditions under which the block output will be correct. Data or objects modeled as controls can be transformed by a function that creates the corresponding output. Control arrows are associated with the top side of the IDEF0 block.
2.45 function: An activity, process or transformation (modeled by the IDEF0 block) identified by a verb or verb form that describes what needs to be done
2.46 objective: A brief statement of the reason for creating the model.
3 Abbreviations
ICAM - integrated computerization of production.
ICOM - Input, Control, Output, Mechanism.
IDEF0 is the methodology used to create a functional model.
IDEF1 is a methodology used to create an information model.
IDEF2 is the methodology used to create a dynamic model.
FEO is an illustration diagram.
4 IDEF0 concept
The IDEF0 methodology is based on the following conceptual provisions.
4.1 Model is an artificial object that is a reflection (image) of the system and its components. It's believed that
M models A if M answers questions about A.
Here M is a model, A is a modeled object (original). The model is developed to understand, analyze and make decisions about reconstruction (reengineering) or replacement of an existing one, or design of a new system. The system is a collection of interconnected and interacting parts that perform some useful work... Parts (elements) of the system can be any combination of various entities, including people, information, software, equipment, products, raw materials or energy (energy carriers). The model describes what happens in the system, how it is controlled, what it transforms, what tools it uses to perform its functions, and what it produces.
4.2 Block modeling and its graphical representation. The main conceptual principle of the IDEF methodology is the representation of any system under study as a set of interacting and interconnected blocks that reflect processes, operations, actions (see below for definitions) that occur in the system under study. In IDEF0, everything that happens in the system and its elements is called functions. Each function is assigned a block. In the IDEF0 diagram, the main document in the analysis and design of systems, the block is a rectangle. The interfaces through which the block interacts with other blocks or with an environment external to the modeled system are represented by arrows entering or leaving the block. Incoming arrows show what conditions must be simultaneously fulfilled for the function described by the block to be realized.
4.3 Conciseness and accuracy. The documentation describing the system must be accurate and concise. Information about the properties and characteristics of the system in the form of traditional texts is in this sense unsatisfactory, since it often contains redundant information, allows for ambiguous interpretation, etc. The graphical language makes it possible to concisely, unambiguously and accurately show all elements (blocks) of the system and all relations and connections between them, identify erroneous, unnecessary or duplicate connections, etc.
4.4 Transfer of information. IDEF0 tools facilitate the transfer of information from one model developer (individual developer or team) to another. These funds include:
Diagrams based on simple block and arrow graphics, easy to read and understand;
Natural language labels to describe blocks and arrows, as well as a glossary and accompanying text that clarify the meaning of diagram elements;
Sequential decomposition of diagrams, based on a hierarchical principle, in which the main functions are displayed at the top level, and then they are detailed and refined;
Tree diagrams of the hierarchy of diagrams and blocks that provide the visibility of the model as a whole and its parts, which is especially important when modeling large systems.
4.5 Rigor and formalism. The development of IDEF0 models requires adherence to a number of strict formal rules that provide the methodology with the benefits of unambiguity, accuracy, and integrity of complex layered models. These rules are described below. Only the main one is noted here: at all stages and stages of development and adjustment of the model, the syntactic and semantic rules of the graphic language must be strictly, formally observed, and the results must be carefully documented so that during its operation there are no questions related to incompleteness or incorrectness of the documentation ... Design / IDEF 3.7 (and later) by Meta Software Corporation supports automatic compliance with most of the listed rules.
4.6 Iterative modeling. Model development in IDEF0 is a step-by-step, iterative procedure. At each step of the iteration, the developer proposes a version of the model, which is discussed, reviewed and subsequently edited, after which the cycle repeats. This organization of work contributes to the optimal use of the knowledge of a system analyst who owns the methodology and technique of IDEF0, and the knowledge of specialists - experts in the subject area to which the object of modeling belongs.
4.7 Separating "organization" from "functions". When developing models, one should avoid the initial "binding" of the functions of the system under study to the existing organizational structure of the modeled object (enterprise, firm). This helps to avoid the subjective point of view imposed by the organization and its leadership. The organizational structure should result from the use (application) of the model. Comparison of the result with the existing structure allows, firstly, to assess the adequacy of the model, and secondly, to propose solutions aimed at improving this structure.
5 Syntax of the graphical language IDEF0
The set of structural components of the language, their characteristics and the rules that determine the relationships between the components, represent the syntax of the language. The components of the IDEF0 syntax are blocks, arrows, diagrams and rules. Blocks represent functions, defined as an activity, process, operation, action, or transformation (see below). Arrows represent data or material objects associated with functions. Rules define how components should be applied; charts provide a format for describing models graphically and verbally. The format forms the basis for model configuration management.
The block describes the function. A typical block is shown in Figure 1. Each block contains its name and number. The name must be an active verb or verbal phrase describing the function. The block number is located in the lower right corner. Block numbers are used to identify them in the diagram and in the corresponding text.

Picture 1
5.2 Arrow
An arrow is formed from one or more straight line segments and a tip at one end. As shown in Figure 2, arrow segments can be straight or broken; in the latter case, the horizontal and vertical segments of the arrow are mated by arcs having an angle of 90 °. The arrows do not represent a flow or sequence of events as in traditional flow or process flowcharts (flowcharts). They only show what data or material objects must enter the input of a function in order for this function to be performed.
 Figure 2
5.3 Syntax rules
5.3.1 Blocks
The following syntax rules are set for blocks:
The block sizes must be large enough to include the block name and number;
Blocks must be rectangular with right angles;
Blocks should be drawn with solid lines.
5.3.2 Arrows
The following syntax rules are set for arrows:
Broken arrows change direction only at an angle of 90 °;
Arrows should be drawn in solid lines. Lines of different thickness can be used;
Arrows can only be vertical or horizontal; diagonal line segments are not allowed;
The ends of the arrows must touch the outer boundary of the functional block, but must not cross it;
Arrows must attach to the block on its sides. Joining in corners is not allowed.
6 Semantics of IDEF0 language
Semantics determines the content (meaning) of the syntactic components of the language and contributes to the correctness of their interpretation. Interpretation establishes a correspondence between boxes and arrows, on the one hand, and functions and their interfaces, on the other.
6.1 Semantics of boxes and arrows
Since IDEF0 is a functional modeling methodology, the block name describing the function must be a verb or a verb phrase. For example, the block name "Perform Inspection" means that a block with that name turns unchecked parts into checked ones. After assigning a name to the block, input, output and control arrows, as well as the arrows of the mechanism, are attached to its corresponding sides, which determines the clarity and expressiveness of the image of the IDEF0 block (see Figure 3).

Figure 3
Standard terminology should be used to ensure the accuracy of the model. Blocks are called verbs or verbal phrases, and these names are preserved during decomposition. Arrows and their segments, both separate and connected in a "bundle", are marked with nouns or nouns. Segment labels allow you to concretize the data or material objects transferred by these segments, observing the syntax of branching and merging.
Each side of the function block has a standard purpose in terms of block / arrow communication. In turn, the side of the block to which the arrow is attached uniquely defines its role. Arrow (s) entering (s) to the left side of the block are entry (s). The inputs are transformed or consumed by the function to create what appears at its output. The arrow (s) entering (s) into the block from above are the control (s). The control (s) determine (are) the conditions necessary for the function to produce the correct exit. The arrow (s) leaving the block (s) on the right are the output (s), that is, the data or material objects produced by the function.
The arrows connected to the bottom side of the block represent mechanisms, that is, everything that is used to convert inputs to outputs. Upward pointing arrows identify the means that support the function. Other facilities can be inherited from the parent block. The downward pointing machine arrows are call arrows. Call arrows indicate a call from a given model or from a given part of a model to a block that is part of another model or another part of a model, providing their connection, that is, different models or different parts of the same model can share the same element ( block).
Typical arrow locations are shown in Figure 3.
6.2 Names and labels
As indicated, the function names are verbs or verb phrases.
Examples of such names:
produce parts
oversee the implementation
develop detailed drawings
plan resources
design a system
make a component
watch
exploit
check item
Arrows identify data or material objects that are required to perform a function or are produced by it. Each arrow must be marked with a noun or noun phrase, for example:
specifications
design requirements
design engineer
test report
part design
board assembly
directive
demands
An example of the placement of arrow labels and block names is shown in Figure 4.

Figure 4
6.3 Summary of Semantic Rules for Boxes and Arrows
a) The block name must be a verb or a verb turnover.
b) Each side of the functional block has a standard block / arrow relationship:
Input arrows must bind to the left side of the block;
Control arrows must bind to the top of the block;
The exit arrows must bind to the right side of the block;
Mechanism arrows (except call arrows) must point up and connect to the bottom of the block;
Mechanism call arrows must point down, connect to the bottom of the block, and be labeled with a reference to the called block.
c) Segments of arrows, with the exception of call arrows, must be marked with a noun or a noun phrase, unless a single arrow label refers to the arrow as a whole.
d) To connect an arrow with a label, use a broken lightning-like extension line ().
e) The following terms should not be used in arrow labels: function, input, control, output, mechanism, call.
6.4 IDEF0 diagrams
IDEF0 models consist of three types of documents: graphical diagrams, text, and glossary. These documents are cross-referenced to each other. The graphical diagram is the main component of the IDEF0 model, containing blocks, arrows, connections of blocks and arrows and their associated relations. The blocks represent the main functions of the modeled object. These functions can be broken down (decomposed) into their component parts and presented in the form of more detailed diagrams; the decomposition process continues until the object is described at the level of detail necessary to achieve the goals of a particular project.
The top-level diagram provides the most general description of the object to be modeled. This diagram is followed by a series of child diagrams that provide a more detailed view of the object.
6.5 Top-level context diagram
Each model must have a top-level context diagram, where the modeling object is represented by a single box with boundary arrows. This diagram is called A-0 (A minus zero). The arrows in this diagram represent the relationships of the modeling object with the environment. Since a single block represents the entire object, its name is common to the entire project. The same is true for all arrows in the diagram, since they represent the complete set of external interfaces of the object. Diagram A-0 establishes the modeling area and its boundary. An example of diagram A-0 is shown in Figure 5.

Figure 5
The A-0 context diagram should also contain concise statements defining the point of view of the official or department from whose position the model is being created and the purpose for which it is being developed. These statements help guide the development of the model and help frame the process. The point of view determines what and in what section can be seen within the context of the model. Changing the point of view leads to consideration of other aspects of the object. Aspects important from one point of view may not appear in a model developed from another point of view on the same object.
The formulation of the goal expresses the reason for creating the model, that is, it contains a list of questions to which the model must answer, which largely determines its structure. The most important properties of an object are usually found at the top levels of the hierarchy; as the top-level function is decomposed and divided into subfunctions, these properties are refined. Each subfunction, in turn, is decomposed into elements of the next level, and this continues until a relevant structure is obtained that allows you to answer the questions formulated in the modeling goal. Each subfunction is modeled as a separate block. Each parent block is described in detail by a child diagram at a lower level. All child charts must be within the top-level context chart area.
Known today not only in narrow circles, the abbreviation IDEF0 is the first methodology to standardize work on business processes. It was developed in the middle of the last century as part of an aerospace project in the United States and, having shown its effectiveness, has become a federal standard. In our country, in 2000, a document was prepared " Functional Modeling Methodology IDEF0. Guidance document Functional Modeling Methodology IDEF0 Guidance Document. Official edition. Gosstandart of Russia RD IDEF0 - 2000. Developed by the Research Center CALS - Technologies "Applied Logistics". Adopted and put into effect by the Resolution of the Gosstandart of Russia 2000 Moscow”, But as a standard it was never approved. Although this did not prevent this methodology from becoming one of the most popular tools for graphical modeling of business processes in our country. In this article, I invite you to review the IDEF0 model and assess the current relevance of this approach.
Basic concepts and abbreviations
Let's understand a little about the names of the key elements of the methodology. The IDEF0 graphic standard is part of the SADT (Structured Analysis and Design Technique) methodology. IDEF stands for ICAM Definition, and ICAM is derived from Integrated Computer Aided Manufacturing, which translates as integrated computerization of production. The SADT methodology is a whole family of 15 different models, which in a complex were supposed to allow the study of the structure, parameters and characteristics of production-technical and organizational-economic systems.
IDEF0 is a functional model, which is the core of all other structures, it links together information and material flows, organizational structure, control actions and the very activity of the company. The graphical standard for modeling processes is also called notation. That is, notation is a system of requirements and rules for constructing an activity model in one form or another. Therefore, it is appropriate to call IDEF0 a notation that is part of the SADT methodology.
IDEF0 notation is a fairly rigorous methodology that was originally developed, like technical design standards, for manual modeling. Therefore, it contains requirements for the placement of arrows, the format of all elements, the content of the information frame for the IDEF0 diagram, etc. Since the company's activities are a complex multi-level system of actions, there are always many schemes, and an unambiguous systematization and navigation through all elements of the model is required. Most of them do it now computer systemsthat support modeling in this notation. On the territory of Russia, the most famous and available today are the AllFusion Process Modeler and Business Studio systems. I plan to devote separate articles to the review of these systems.
Functional block
The central element of the IDEF0 model is the function, which is displayed on the diagram as functional block - a rectangle, inside which the action is indicated in the form of a verbal noun. The action can be very different in scale - from the activities of the company in general and to specific manipulation in particular. Examples: "Production and sale of ceramic tableware" and "Drawing on a product".

Mandatory function block elements in IDEF0
Regardless of the scale of actions, all functions are displayed uniformly and necessarily contain 4 key flows that are rigidly assigned to the sides of the functional block:
- on the left - inputs or resources used to perform the function;
- on the right - outputs or results of function execution;
- on top - control actions that determine how and how many results should be produced;
- below - mechanisms that reflect who and with the help of what should do this work.
This approach allows you to save a little on explanations in the diagrams and to achieve unambiguity in the display of flows, which makes the whole model slender.
To build a functional model, the IDEF0 methodology requires the following rules to be observed.
- Inputs are resources that transfer their value to outputs completely, that is, are spent on creating a result in full, and mechanisms are resources that transfer their value only partially (equipment through depreciation, and people through wages).
- Management is a necessary element of the model, since it binds all actions to the system of company regulations, clearly indicating which rules and requirements must be observed in the process of performing the function. Often this flow is treated formally, but at the same time the scheme loses its rigor and sometimes even meaning.
- Each functional block must have at least one arrow on each side (since there can be no work without resources or results, and an instruction without an executor or instruction will be incomplete).
The considered scheme is a "building block" of the IDEF0 approach. Functional modeling involves a gradual transition from the general to the particular due to decomposition. Decomposition is "deepening" into the function under consideration, dividing it into smaller functions. At the same time, when the top-level function is presented in a generalized manner and after it is decomposed, it is appropriate to call it a process.
Context diagram
At the highest level, the company is presented as a "black box" in which some activity takes place, which translates entrances to exits. This level is called "", that is, a diagram describing the context of the company's activities. Additionally, the context diagram displays the key characteristics of the entire model.
- The goal is a specific formulation of the purpose of the model, by which the accuracy of the model construction can be checked in the future.
- Point of view - on whose face the model is built, since the model is always dependent on its author and focus of attention. If we build a general model of the enterprise, then it is usually presented from the point of view of its director.
- The model type is an indication of what information is displayed on the diagrams. There can be 2 basic options: AS IS ("as is") or TO BE ("as will be"). This separation is necessary, since we can build models for both the analysis of activities and for its transformation. We must be clearly aware of what we are doing, and also convey this information to others.
Thus, the context diagram contains in the most generalized form a description of the company's activities, which is permeated by flows that connect the company with the outside world. I think we should also dwell on them in more detail.
Main streams
Experience has shown that, despite the seeming simplicity and formality of this level, it is often necessary to stay at it for a long time, since all the results that are significant for the owner and the market must be reflected here. A mistake can lead to the creation of models that do not fulfill the business objectives. To verify that significant flows are reflected, make sure that all 4 main flow types are present in your diagram.
- Material: materials and components at the entrance and finished products at the exit.
- Client: a potential client at the entrance and a satisfied one at the exit.
- Financial: at the entrance, this is usually investments, customer payments (revenue), loans and other income; the output is payments to suppliers, taxes, loan payments and profits.
- Informational: at the entrance, these are all flows of information about the external environment (market conditions, competitors' behavior, technological innovations, etc.), and at the exit, this is the flow of information that the company communicates about itself to the world (all advertising information, as well as all types of reporting before the regulatory authorities).
Please note that a company is an open system, and nothing appears or disappears in it. A company is only able to transform incoming flows into outgoing ones, and if it does it well, then an additional cash flow (profit) appears, reflecting, in a sense, the quality of the entire system.

(click to enlarge)
It is good if you highlight each of these types of flows with your own color so that you can easily distinguish the movement of resources and do not miss important points. For example, it is often possible to observe the absence of a client in the company's flows, therefore, work with him is built on a leftover principle - the client often feels like a hindrance for the company's employees whose tasks are focused on processing the flow of documents.
Control arrows can be represented by only 1 type of flow - information flow, which can be divided into 2 subspecies. The first is documents such as:
- laws and regulations;
- orders, orders;
- instructions and regulations;
- plans;
- design documentation, etc.
The second is undocumented information, which most often includes the requirements of the owners.
And finally, mechanisms - there are only 2 types of flows: equipment (material) and performers (departments and people). There can be no documents here, just as there can be no people on the control points!
For navigation, the model provides continuous numbering. The context diagram is numbered "A-0". In the future, each functional block gets its own number, no matter how deep the decomposition is.
Decomposition
After working out the flows of the context diagram, we can proceed to decomposition. Moving to a level below, as if opening a "black box", we first see a blank sheet with arrows that have been attached to the functional block.

(click to enlarge)
And here the actual functional modeling already begins - we must understand what set of actions can connect these flows and ensure that all requirements are met. The difficulty lies in the fact that there are a lot of actions in the company, and on the diagram we have the right to display no more than 9 functions, otherwise the diagram will become unreadable and, accordingly, useless.
It is not always easy to arrange complex activities so that they remain visual, readable, and yet complete. Most often, they resort to dividing the entire variety of processes into main large blocks, the most significant of which are the following.
- Creation of a product (result).
- Promotion and sale - working with customer flow.
- Ensuring product creation activities are secondary processes that are necessary to comply with government requirements or to ensure the convenience of work (personnel and accounting, transport services, cleaning of premises, etc.).
- Creation of management flows - the activity of developing management solutions that will determine the requirements for all processes of the company.
The figure below shows the decomposition diagram of our example.

(click to enlarge)
In the diagram, the processes should be arranged diagonally - this is called dominance principle, which implies the arrangement of functional blocks from left to right and from top to bottom - in order of importance or in chronological order. Block numbering is the same.
Further work on the model is similar to the first step - each functional block of the first level is decomposed. Block numbering will contain the number of the first level: A1.1… A1n, A2.1… A2.n, etc.
Conclusions about the relevance of the notation
Within the framework of this article, it was possible to display only the basic concepts of IDEF0-notation using a short example of IDEF0, by which, of course, it is difficult to judge the methodology in general. But quite a lot of experience in using this notation in practice allows me to draw the following conclusions.
- The model has good visualizing potential, but, in my opinion, its greater importance is in the disciplining effect. The rules and limitations embedded in the methodology force us to develop a systematic and strict attitude to the models, which has a very good effect on the quality of the final result.
- The model allows you to build communication flows between seemingly not tightly connected things: to connect the front and back office subsystems with management, which is much worse for other notations.
- The approach is simple and straightforward for most of the project participants. Building and reading diagrams in this notation is limited only by the desire to delve into the intricacies of business flows.
Some of the above arguments make one think that this approach is the best and only one for complete modeling of activities. But do not forget that the functional model is designed only for the upper level of modeling. The use of the IDEF0 notation for the design of work at the performer level leads to the fact that the diagrams are purely illustrative and on their basis it is impossible to build a sensible regulation, since they do not contain:
- concretization of the events of starting and stopping the process;
- conditions for the transition from one action to another;
- the ability to visually display all resources and performers without overloading the diagram with arrows.
Therefore, if you use this notation for the tasks for which it is intended (structuring top-level activities), then IDEF0 is practically the only notation for today that allows you to do this meaningfully and accurately.
In project management, this modeling standard is most applicable where it is necessary to link different projects or processes with visual flows. At the same time, the graphical model will allow for a more rational distribution of responsibility and resources by tasks. The logic of the project tasks, reflected in the diagrams, will help prepare a better schedule in the form of a Gantt chart.
IDEF0-models consist of three types of documents: graphic diagrams, text and glossary. These documents are cross-referenced to each other.
A diagram can be associated with structured text, which is a short commentary on the content of the diagram. The text is used to explain and clarify characteristics, streams, interconnections, etc. Text should not be used to describe already clear blocks and arrows in diagrams.
The glossary is intended to identify abbreviations (acronyms), keywords and phrases used as names and labels in charts. The glossary defines concepts and terms that must be equally understood by all participants in the development and users of the model in order to correctly interpret its content.
The graphical diagram is the main component of the IDEF0 model, containing blocks, arrows, connections of blocks and arrows and their associated relations. The blocks represent the main functions of the modeled object. These functions can be broken down (decomposed) into their component parts and presented in the form of more detailed diagrams; the decomposition process continues until the object is described at the level of detail necessary to achieve the goals of a particular project. The top-level diagram provides the most general or abstract description of the object to be modeled. This diagram is followed by a series of child diagrams that provide a more detailed view of the object.
Each model must have a top-level context diagram, where the modeling object is represented by a single box with boundary arrows. This diagram is called A – 0 (A minus zero). The arrows in this diagram represent the relationships of the modeling object with the environment. Since a single block represents the entire object, its name is common to the entire project. The same is true for all arrows of the diagram, since they represent full set external interfaces of the object. The A – 0 diagram sets the modeling area and its boundary. An example of a diagram A – 0 is shown in Fig. 3.10., Fig. 3.11., Fig. 3.12.
Figure: 3.10. Example of a context diagram

Figure: 3.11. Example of a context diagram

Figure: 3.12. Example of a context diagram
The A – 0 context diagram should also contain concise statements that define the point of view of the official or department from which the model is being built and the purpose for which it is being designed. These statements help guide the development of the model and help frame the process.
The point of view determines what and in what section can be seen within the context of the model. Changing the point of view leads to consideration of other aspects of the object. Aspects important from one point of view may not appear in a model developed from another point of view on the same object.
The goal statement expresses the reason for creating the model, i.e. contains a list of questions that the model should answer, which largely determines its structure.
The most important properties of an object are usually found at the top levels of the hierarchy; as the top-level function is decomposed and divided into subfunctions, these properties are refined. Each subfunction, in turn, is decomposed into elements of the next level, and this continues until a relevant structure is obtained that allows you to answer the questions formulated in the modeling goal. Each subfunction is modeled as a separate block. Each parent block is described in detail by a child diagram at a lower level. All child charts must be within the top-level context chart area.
At the initial stages of creating an IP, it is necessary to understand how the organization that is going to automate works. No one in the organization knows how it works to the extent of the detail needed to create IP. The manager knows the work as a whole well, but is not able to delve into the details of the work of each ordinary employee. An ordinary employee knows well what is happening at his workplace, but he does not know well how his colleagues work. Therefore, to describe the work of the enterprise, it is necessary to build a model. Such a model should be adequate to the subject area, therefore, it should contain the knowledge of all participants in the organization's business processes.
The most convenient language for modeling business processes is IDEF0, proposed more than 20 years ago by Douglas Ross (SoftTech, Inc.) and originally called SADT - Structured Analysis and Design Technique. (In the early 1970s, the US military used the process modeling subset of the SADT to implement ICAM (Integrated Computer-Aided Manufacturing) projects. This subset of SADT was later adopted as a US federal standard under the name IDEF0. specifications for IDEF standards can be found at http://www.idef.com.
In IDEF0, a system is represented as a collection of interacting activities or functions. This purely functional orientation is fundamental - the functions of the system are analyzed independently of the objects with which they operate. This allows you to more clearly model the logic and interaction of the organization's processes.
A model in IDEF0 is understood as a description of the system (textual and graphic), which should answer some predefined questions.
The modeled system is considered as an arbitrary subset of the Universe. Arbitrary because, firstly, we ourselves speculatively determine whether an object will be a component of the system, or we will consider it as an external influence, and, secondly, it depends on the point of view of the system. The system has a border that separates it from the rest of the universe. The interaction of the system with the outside world is described as input (something that is processed by the system), output (the result of the system's activity), control (strategies and procedures under which the work is carried out) and mechanism (resources required to carry out the work). While under control, the system converts inputs to outputs using mechanisms.
The process of modeling any system in IDEF0 begins with defining the context, i.e. the most abstract level of describing the system as a whole. The context includes the definition of the subject of modeling, the purpose and point of view of the model.
The subject is understood as the system itself, while it is necessary to establish exactly what is included in the system and what lies outside it, in other words, we must determine what we will further consider as components of the system and what as an external influence. The definition of the subject of the system will be significantly influenced by the position from which the system is considered, and the purpose of modeling is the questions that the constructed model should answer. In other words, it is first necessary to define the scope of the simulation. Description of the area of \u200b\u200bboth the system as a whole and its components is the basis for building the model. Although it is assumed that the area can be adjusted during modeling, it should be mostly formulated initially, since it is the area that determines the direction of modeling and when the model should be completed. When formulating an area, there are two components to consider - breadth and depth. Latitude means defining the boundaries of the model - we define what will be considered inside the system and what is outside. Depth determines at what level of detail the model is complete. When determining the depth of the system, one must not forget about the time constraints - the complexity of building a model grows exponentially with the depth of decomposition. After defining the boundaries of the model, it is assumed that new objects should not be introduced into the modeled system; since all the objects in the model are interconnected, adding a new object may not be just an arithmetic addition, but may be able to change existing relationships. Making such changes to the finished model is usually a very laborious process (the so-called "floating area" problem).
Purpose of modeling.A model cannot be built without a clearly defined goal. The target should answer the following questions:
Why should this process be modeled?
What should the model show?
What can the reader get?
A goal statement enables the analyst team to focus efforts in the right direction. Examples of statement of purpose include the following statements: "To identify and define current problems, to enable analysis of potential improvements", "To identify the roles and responsibilities of employees for writing job descriptions", "To describe the functionality of the enterprise for the purpose of writing information system specifications", etc.
Viewpoint... Although the views of different people are taken into account when building the model, the model should be built from a single point of view. The point of view can be represented as the view of a person who sees the system in the aspect necessary for modeling. The point of view must be consistent with the purpose of the simulation. Obviously, the description of the enterprise from the point of view of a financier and a technologist will look completely different, therefore it is important to remain on the chosen point of view during the simulation. As a rule, the point of view of the person responsible for the simulated work as a whole is chosen. Often, when choosing a model viewpoint, it is important to document additional alternative viewpoints. For this purpose, FEO (For Exposition Only) charts are usually used.
The IDEF0 model assumes the presence of a clearly formulated goal, a single subject of modeling and one point of view. To enter the scope, goal and point of view in the IDEF0 model in BPwin, select the menu item Edit / Model Propertiescalling the Model Properties dialog (Fig. 4). In the bookmark Purposethe goal and point of view should be entered, and the bookmark Definition- model definition and area description.
In the bookmark Statusin the same dialog, you can describe the status of the model (draft, working, final, etc.), the time of creation and last editing (tracked later automatically by the system date). In the bookmark Sourcedescribes the sources of information for building the model (for example, "Survey of domain experts and analysis of documentation"). Bookmark Generalserves to enter the name of the project and model, the name and initials of the author and the time frame of the model - AS-ISand TO-BE.
Figure: 4. Dialogue for setting model properties
AS-IS and TO-BE models... Usually, a model of the existing work organization is built first - AS-IS (as is). Based on the AS-IS model, a consensus is achieved between different business units on "who did what" and what each business unit adds to the process. The AS-IS model allows us to figure out "what we are doing today" before jumping to "what we will do tomorrow". The analysis of the functional model allows you to understand where the weakest points are, what will be the advantages of new business processes and how deeply the existing structure of the business organization will undergo changes. The granularity of business processes makes it possible to identify the shortcomings of the organization, even where the functionality seems obvious at first glance. Signs of ineffective activity can be useless, unmanaged and duplicated work, ineffective workflow (the required document is not in the right place at the right time), the lack of feedback on management (the work is not influenced by its result), input (objects or information are used irrationally ), etc. The shortcomings found in the AS-IS model can be corrected when creating a TO-BE model (as it will be) - a model of a new organization of business processes. The TO-BE needs a model to analyze alternative / best ways to get work done and document how the company will do business in the future.
A common mistake when creating an AS-IS model should be pointed out is creating an idealized model. An example is the creation of a model based on the knowledge of the manager, and not on the specific contractor. The manager is familiar with how the work is supposed to be performed according to the manuals and job descriptions and often does not know how the subordinates actually perform routine work. The result is an embellished, distorted model that carries false information and which cannot be further used for analysis. This model is called SHOULD_BE (as it should be).
The IS design technology implies first the creation of an AS-IS model, its analysis and improvement of business processes, that is, the creation of a TO-BE model, and only on the basis of the TO-BE model a data model, a prototype, and then the final version of the IS are built. Building a system based on the AS-IS model leads to enterprise automation on the principle of "leaving everything as it is, just so that computers stand", that is, the IS automates imperfect business processes and duplicates rather than replaces the existing workflow. As a result, the implementation and operation of such a system only leads to additional costs for the purchase of equipment, software development and maintenance of both.
Sometimes the current AS-IS and future TO-BE models differ very much, so that the transition from the initial to the final state becomes unobvious. In this case, a third model is needed, which describes the process of transition from the initial to the final state of the system, since such a transition is also a business process.
The result of the model description can be obtained in the report Model Report... The dialog for setting up a report on a model is called from the menu item Report / Model Report... In the settings dialog, select the required fields, and the order of information output to the report is automatically displayed (Fig. 5).

Figure: 5. Model report
IDEF0 diagrams.The IDEF0 methodology is based on a graphical language for describing business processes. A model in IDEF0 notation is a collection of hierarchically ordered and interconnected diagrams. Each diagram is a unit of the system description and is located on a separate sheet.
The model can contain four types of charts:
context diagram (each model can have only one context diagram);
decomposition diagrams;
node tree diagrams;
exposure-only diagrams (FEO).
The context diagram is the top of the diagram tree structure and represents the most general description of the system and its interaction with the external environment. After describing the system as a whole, it is divided into large fragments. This process is called functional decomposition, and the diagrams that describe each fragment and the interaction of the fragments are called decomposition diagrams. After decomposition of the context diagram, each large fragment of the system is decomposed into smaller ones, and so on, until the required level of description is reached. After each decomposition session, examination sessions are held - subject area experts indicate the correspondence of real business processes to the created diagrams. The found inconsistencies are corrected, and only after passing the examination without comments, you can proceed to the next session of decomposition. This is how the model matches the real business processes at any and every level of the model. The syntax for describing the system as a whole and each of its fragments is the same throughout the model.
The node tree diagram shows the hierarchical relationship of activities, but not the relationship between activities. There can be arbitrarily many node tree diagrams in the model, since the tree can be built to an arbitrary depth and not necessarily from the root.
Exposure diagrams (FEO) are constructed to illustrate individual portions of a model, to illustrate an alternative point of view, or for special purposes.
An example of creating a functional model.
As an example, the activity of the fictional company "Computer Word" is considered. The company is mainly engaged in the assembly and sale of desktops and laptops. The company does not manufacture components on its own, but only assembles and tests computers.
The main types of work in the company are as follows:
sellers take orders from customers;
operators group orders by computer type;
operators assemble and test computers;
operators pack computers according to orders;
storekeeper ships orders to customers.
The company uses a licensed accounting information system that allows you to place an order, invoice and track payments on invoices.
Work methodology
1. Run BPwin ().
2. If a dialogue appears ModelMart Connection Manager, click the button Cancel(Cancel).
3. Click the button. A dialog box appears I would like to(fig. 6). Fill in the text box Namemodel name "Company Activity" and select Tour - Business Process (IDEF0)... Click the button OK.

Figure: 6. Assigning a name to the model and choosing a model type
4. A dialog box will open Properties for New Models(Properties of the new model) (Fig. 7). Enter in the text box Author(Author) the name of the author of the model and in the text box Author initialshis initials. Press the buttons in sequence Applyand OK.

5. An empty context diagram is automatically created (Fig. 8).
6. Notice the button on the toolbar. This button toggles the view and navigation tool on and off - Model Explorer(Model Browser). Model Explorer has three tabs - Activities (), Diagrams () and Objects (). In the tab Activitiesright-clicking on an object in the model browser allows you to select options for editing its properties (Fig. 9).

Figure: 8. Blank context diagram

Figure: 9. Click right click by object in the Activities tab allows you to use the context menu to edit its properties
7. Go to the menu Model / Model Properties... In the tab Generaldialog box Model Propertiesinto a text box Model nameenter the model name "Company activities", and in the text box Projectthe name of the project "Model of the company's activity", and, finally, in the text Time frame(Time coverage) - AS-IS(As is) (fig. 10).

Figure: 10. Window for setting model properties
8. In the tab Purposedialog box Model Propertiesinto a text box Purpose(goal) enter the data on the goal of developing the model - "Simulate the current (AS-IS) business processes of the company", and in the text box Viewpoint(point of view) - "Director" (Fig. 11).

Figure: 11. Entering data about the modeling goal and point of view
9. In the tab Definitiondialog box Model Propertiesinto a text box Definition(Definition) enter "This is a business training model" and in the text box Scope(coverage) - "General business management of the company: market research, procurement of components, assembly, testing and sale of products" (Fig. 12).
10. Go to the context diagram and right-click on the rectangle representing, in notation IDEF0, conditional graphic designation of work. AT context menu select an option Name(fig. 13). In the tab Nameenter the name "Company Activities" (Fig. 14).
11. In the tab Definitiondialog box Activity Propertiesinto a text box Definition(Definition) enter "Current business processes of the company" (Figure 15). Text field Note(Notes) leave blank.

Figure: 12. Entering additional data defining the model

Figure: 13. Context menu for working with the selected option Name

Figure: 14. Assigning a title to the work

Figure: 15. Entering additional data on work
12. Create ICOM-arrows on the context diagram (table 1).
Table 1 - Arrows of the context diagram
|
Arrow name (ArrowName) |
Arrow definition (ArrowDefinition) |
Arrow type (ArrowType) |
|
Customer calls |
Information requests, orders, technical support, etc. | |
|
Rules and procedures |
Sales rules, assembly instructions, testing procedures, performance criteria, etc. | |
|
Products sold |
Desktop and laptop computers | |
|
Accounting system |
Making invoices, paying bills, working with orders |
13. Using the button, enter the text in the diagram field - point of view and purpose (Fig. 16).

Figure: 16. Entering text into the chart field using the Text Block Editor
14. Create a report on the model. On the menu Tools / Reports / Model Report(Fig. 17) set the options for generating the report (check the boxes) and click the button Preview(Preview) (fig. 18).

Figure: 17. Setting options for generating a Model Report

Figure: 18. Preview Model Report
Decomposition of production processes by methodologyIDEF0
Works (Activity)
Jobs refer to named processes, functions, or tasks that occur over time and have recognizable results. The works are depicted as rectangles. All jobs must be named and defined. The name of the work must be expressed by a verbal noun denoting the action (for example, "Making a part", "Taking an order", etc.). The work "Manufacturing a part" can have, for example, the following definition: "The work refers to the entire cycle of manufacturing a product from quality control of raw materials to the shipment of the finished packaged product." When creating a new model (menu File / New) a context diagram with a single work depicting the system as a whole is automatically created (Fig. 1).
To enter the name of the job, right-click on the job, select Name Editorand enter the name of the job in the dialog that appears. To describe other properties of the work, use the dialog Activity Properties(fig. 2).

Figure: 1. Example of a context diagram

Figure: 2. Editor for setting job properties
Decomposition diagrams contain related activities, i.e. child jobs that have a common parent job. To create a decomposition diagram, click the button.
Dialogue arises Activity Box Count(Fig. 3), in which you should indicate the notation of the new diagram and the number of works on it. Let's choose notation IDEF0and click on OK... The decomposition diagram appears (Fig. 4). The allowed interval for the number of jobs is 2-8. It makes no sense to decompose a job into one job: diagrams with more than eight jobs turn out to be oversaturated and poorly readable. To provide clarity and better understanding of the simulated processes, it is recommended to use from three to six blocks in one diagram.

Rice. 3. Dialog Activity Box Count

Figure: 4. Example of a decomposition diagram
If it turns out that the number of jobs is not enough, then the job can be added to the diagram by first clicking on the button on the tool palette, and then on the free space on the diagram.
Work in decomposition diagrams is usually arranged diagonally from the upper left corner to the lower right.
This order is called the dominance order. According to this principle of arrangement in the left upper corner the most important work is located or the work performed first in time. Further down to the right are less important or later work. This arrangement makes the diagrams easier to read and is also the basis for the concept of work relationships.
Each of the activities in the decomposition diagram can be decomposed in turn. The work breakdown diagram is numbered automatically from left to right. The job number is shown in the lower right corner. In the upper left corner, there is a small diagonal line, which indicates that this work has not been decomposed. So, for example, the work "Assemble product" has number 3 and has not yet been decomposed. The work "Quality control" (number 4) has a lower level of decomposition
Arrows
The interaction of works with the outside world and among themselves is described in the form of arrows. The arrows represent some information and are named with nouns (for example, "Blank", "Product", "Order").
IDEF0 distinguishes between five types of arrows:
Input- material or information that is used or transformed by the work to obtain a result (output). It is assumed that the work may not have any entry arrows. Each type of arrow goes to or from a particular side of the work rectangle. The entry arrow is drawn as entering the left side of the work. When describing technological processes (for this, IDEF0 was invented), there are no problems with defining inputs. Indeed, "Raw material" in fig. 1. is something that is processed in the "Manufacturing" process to obtain a result. When modeling IS, when the arrows are not physical objects, but data, not everything is so obvious. For example, when "Admitting a patient", the patient record can be both at the entrance and at the exit, meanwhile the quality of this data changes. In other words, in this example, in order to justify its purpose, the entry and exit arrows must be precisely defined to indicate that the data has indeed been processed (for example, the exit is "Completed Patient Record"). It is often difficult to determine if the data is input or control. In this case, a hint can be whether the data is being processed / changed in operation or not. If they change, then most likely this is an input, if not - control.
Control- the rules, strategies, procedures or standards that govern the work. Each job must have at least one control arrow. The control arrow is drawn as entering the upper face of the work. In fig. 1 arrows "Task" and "Drawing" - control for work "Manufacturing". Management affects work, but is not transformed by work. If the goal of the work is to change a procedure or strategy, then such a procedure or strategy will be the input for the work. In case of uncertainty in the status of the arrow (control or input), it is recommended to draw the control arrow.
Output- the material or information that is produced by the work. Each job must have at least one exit arrow. Work without results is meaningless and should not be modeled. The exit arrow is drawn as coming from the right side of the work. In fig. 1 arrow "Finished product" is an output for the "Manufacturing product" work.
Mechanism- resources that perform work, for example, enterprise personnel, machines, devices, etc. The arrow of the mechanism is drawn as included in the lower edge of the work. In fig. 1 arrow "Enterprise personnel" is a mechanism for the "Manufacturing product" operation. At the analyst's discretion, the mechanism arrows may not appear in the model.
Call- a special arrow pointing to a different model of work. The call arrow is drawn as coming from the bottom edge of the work. In fig. 1 arrow "Other model of work" is a call for work "Manufacturing of a product". A call arrow is used to indicate that some work is being done outside the simulated system. In BPwin, call arrows are used in the model merge and split engine.
Boundary arrows.The arrows on the context diagram are used to describe the interaction of the system with the outside world. They can start at the border of the diagram and end at the work, or vice versa. These arrows are called boundary arrows.
To enter the boundary arrow of the entrance, you should:
Control arrows, exit, mechanism and exit are depicted in the same way. To draw an exit arrow, for example, click on the button with an arrow symbol in the tool palette, click on the right side of the work on the exit side (where the arrow begins), move the cursor to the right side of the screen until the initial dash bar appears, and click once along the dashed strip.
The names of the newly added arrows are automatically entered into the dictionary ( Arrow Dictionary).
ICOM codes.The decomposition diagram is for detailing the work. Unlike models that display the structure of an organization, working in a top-level diagram in IDEF0 is not a control for subordinate activities. Low-level jobs are the same as high-level jobs, but in more detail. As a consequence, the boundaries of the top-level work are the same as the boundaries of the decomposition diagram. ICOM(abbreviation from Input, Control, Output and Mechanism) - codes designed to identify boundary arrows. The code ICOMcontains a prefix corresponding to the arrow type ( I,FROM,ABOUTor M), and a serial number. BPwin fills in ICOM codes automatically. To display ICOM codes, enable the Show ICOM codes option on the Presentation dialogue Model Properties.
The arrow dictionary is edited using a special editor Arrow Dictionary Editor, in which the arrow is defined and a comment related to it is made (Fig. 6). The arrow dictionary solves a very important problem. Diagrams are created by the analyst in order to conduct an examination session, that is, to discuss the diagram with a subject matter expert. In any subject area, professional jargon is formed, and very often jargon expressions have an unclear meaning and are perceived by different specialists in different ways. At the same time, the analyst - the author of the diagrams should use those expressions that are most understandable to the experts. Since formal definitions are often difficult to understand, the analyst is forced to use professional jargon, and in order to avoid ambiguous interpretations, each concept can be given an extended and, if necessary, formal definition in the dictionary of arrows.
The contents of the arrow dictionary can be printed as a report (menu Report / Arrow Report ...) and thereby obtain an explanatory dictionary of the domain terms used in the model.

Rice. 5. Dialog Arrow Properties

Figure: 6. Arrows Dictionary
Unconnected border arrow.When a work is decomposed, the arrows entering and leaving it (except for the call arrow) automatically appear on the decomposition diagram (arrow migration), but they do not touch the works. These arrows are called unbound arrows and are treated as a syntax error by BPwin. To link the arrows of an input, control or mechanism, you need to go to the edit mode of the arrows, click on the arrowhead and click on the corresponding segment of the work. To link the exit arrow, go to the arrow edit mode, click on the work exit segment and then on the arrow.
Internal arrows.Internal arrows are used to connect the work to each other, i.e. arrows that do not touch the border of the diagram, start at one and end at another work.
To draw the inner arrow, in the arrow drawing mode, click on a segment (for example, an exit) of one job and then on a segment (for example, an entrance) of another. IDEF0 distinguishes between five types of work relationships.
Input communication (output-input), when the arrow of the exit of the higher-level work (hereinafter - simply the exit) is directed to the entrance of the lower-level work.
Control communication (output-control)when the output of the superior job is routed to the control of the downstream job. The management link shows the dominance of the superior work. The data or output objects of a higher-level job do not change in the lower-level job.
Output-input feedbackwhen the output of the lower-level job is routed to the input of the higher-level job. This relationship is typically used to describe cycles.
Output-control feedbackwhen the output of a subordinate job is routed to a higher-level job. Management feedback is often indicative of the effectiveness of the business process.
Output-mechanism relationshipwhen the output of one work is directed to the mechanism of another. This relationship is used less frequently than others and shows that one job prepares the resources needed to carry out another job.
Explicit arrows... An explicit arrow has a single job as a source and a single job as a destination.
Branching and merging arrows... The same data or objects generated by one job can be used in several other jobs at once. On the other hand, arrows generated in different works can represent the same or homogeneous data or objects that are later used or processed in one place. To simulate such situations, IDEF0 uses branching and merging arrows. To branch the arrow, in the arrow editing mode, click on the arrow fragment and on the corresponding work segment. To merge two exit arrows, in the arrow edit mode, first click on the segment of the work exit, and then on the corresponding fragment of the arrow.
The meaning of branching and merging arrows is conveyed by the naming of each branch of the arrows. There are certain rules for naming such arrows. Let's consider them using the example of branching arrows. If an arrow is named before the fork, and no branches are named after the fork, then each branch is assumed to model the same data or objects as the branch before the fork.
If an arrow is named before the branching, and after the branching any of the branches is not named, then it is assumed that these branches correspond to the naming. If, in this case, any branch remains unnamed after the branching, then it is assumed that it models the same data or objects as the branch before the branching.
The situation is unacceptable when the arrow is not named before the branch, and after the branch is not named any of the branches. BPwin defines this arrow as a syntax error.
The rules for naming the merging arrows are completely analogous - an error will be considered an arrow that is not named after the merge, and before the merge any of its branches were not named. To name a separate branch of branching and merging arrows, select only one branch on the diagram, then call the name editor and assign a name to the arrow. This name will only match the selected branch.
Tunneling arrows... Newly introduced boundary arrows in the lower-level decomposition diagram are shown in square brackets and do not automatically appear in the upper-level diagram.
To "drag" them up, you must first select the button on the tool palette and click on the square brackets of the boundary arrow. Dialogue appears Border Arrow Editor (fig. 7).

Rice. 7. Dialog Border Arrow Editor
If you click on the button ResolveBorderArrow, the arrow will migrate to the top-level diagram if by clicking on the ChangeToTunnel button the arrow is tuned and does not fall on another diagram.
Tunneling can be used to depict insignificant arrows. If on any diagram of the lower level it is necessary to depict insignificant data or objects that are not processed or used by the works at the current level, then they must be sent to a higher level (to the parent diagram). If this data is not used in the parent diagram, it needs to be directed even higher, and so on. As a result, an unimportant arrow will be displayed at all levels and will make it difficult to read all the diagrams where it is present. The exit is the tunneling arrow at the lowest level. This tunneling is called "not-in-parent-diagram".
An example of creating a decomposition diagram
1. Select the button to move to the bottom level in the tool palette and in the dialog box Activity Box Count(fig. 8) set the number of jobs on the lower level diagram - 3 - and click OK.

Figure: 8. Activity Box Count Dialog Box
2. A decomposition diagram will be automatically created (Fig. 9).

Figure: 9. Decomposition diagram
Right-click on the work in the upper left corner of the model editing area, select the option from the context menu Nameand fill in the name of the job. Repeat the operation for the remaining two jobs. Then fill in the definition, status, and source for each job as shown in Table 1.
Table 1. Works of the decomposition diagram A0
The decomposition diagram will take the form shown in Fig. ten.

Fig. 10 Decomposition diagram after assigning names to works
3. To change the properties of jobs after entering them into the diagram, you can use the dictionary of jobs (Fig. 11). The dictionary is called using the main menu item Dictionary / Activity.

Rice. 11. Dictionary Activity Dictionary
If you describe the name and properties of the work in the dictionary, you can add it to the diagram later using the button in the tool palette. It is not possible to remove a job from the dictionary if it is used in any diagram. If a work is removed from the diagram, it is not removed from the dictionary. The name and description of such work can be used later. To add a work to the dictionary, go to the end of the list and right-click on the last line. A new line appears, in which you need to enter the name and properties of the job. To delete all job names not used in the model, click the ( Purge(Clean)).
4. Switch to the arrow drawing mode and connect the boundary arrows using the button on the tool palette as shown in fig. 12.

Figure: 12. Associated boundary arrows in diagram A0
5. Right-click on the "Compiling and testing computers" branch of the control arrow and rename it to "Build and test rules" (Fig. 13). Redefine the new branch: "Build instructions, test procedures, performance criteria, and so on." Right-click on the branch of the arrow of the Sales and Marketing mechanism and rename it as Ordering System (Figure 14).

Figure: 13. Arrow "Build and Test Rules"

Figure: 14. Arrow "Ordering system"
6. An alternative method of entering names and properties of arrows is to use the arrow dictionary (call the dictionary - menu Dictionary / Arrow). If you enter the name and properties of the arrow in the dictionary (Figure 15), you can add it to the diagram later.

Figure: 15. Dictionary of arrows
An arrow cannot be removed from the dictionary if it is used in any diagram. If you remove an arrow from a diagram, it is not removed from the dictionary. The name and description of such an arrow can be used later. To add an arrow, go to the end of the list and right-click on the last line. Arises new line, in which you need to enter the name and properties of the arrow.
7. Create new inner arrows as shown in fig. sixteen.

Figure: 16. Inner arrows of the diagram A0
8. Create an arrow feedback (under management) "Build and Test Results", going from the "Build and Test Computers" work to the "Sales and Marketing" work. Change, if necessary, the arrow style (line width) and set the option Extra arrowhead(Optional Arrowhead) (from the context menu). Method drag & droptransfer the arrow names to make them easier to read. If necessary, set from the context menu Squiggle(Squiggle). The result of possible changes is shown in Fig. 17.

Figure: 17. Result of editing arrows on diagram A0
9. Create a new Marketing Materials exit bounding arrow coming out of the Sales and Marketing activity. This arrow does not automatically land on the top-level diagram and has square brackets on the tip (Figure 18).

Figure: 18. Arrow Marketing Materials
10. Right-click on the square brackets and select the menu item Arrow Tunnel (fig. 19).
In the dialog box Border Arrow Editor(Boundary Arrow Editor) select option Resolve it to Border Arrow (Allow as Boundary Arrow) (fig. 20).

Rice. 19. Paragraphmenu Arrow Tunnel

Rice. 20. Dialoguewindow Border Arrow Editor
For the arrow "Marketing Materials" select the option Trim(Arrange) from the context menu. The result of the laboratory work is shown in Fig. 21.

Figure: 21. The result of the decomposition
Keywords:structural analysis and design, functional model, functional block, interface arc, context diagram, decomposition, glossary, goal, point of view, subprocess highlighting, decomposition, complexity limitation, tunneling.
Definition
IDEF0 (Integration Definition for Function Modeling) - a functional modeling methodology for describing the functions of an enterprise, offering a functional modeling language for the analysis, development, reengineering and integration of information systems of business processes; or software engineering analysis.
The IDEF0 methodology is a development of the SADT (Structured Analysis and Design Technique) method of structural analysis and design.
IDEF0 as a standard was developed in 1981 within the framework of the ICAM (Integrated Computer Aided Manufacturing) program.
IDEF0 – Integration DEFinition language 0 - based on SADT and in its original form includes both: the definition of a graphical modeling language (syntax and semantics) and a description of a comprehensive methodology for developing models.
The latest revision of IDEF0 was released in December 1993 by the US National Institute of Standards and Technology (NIST).
In 1993, IDEF0 was adopted as a federal standard in the USA, and in 2000 as a standard in the Russian Federation.
Application of IDEF0
IDEF0 is used to create functional model, that is, the result of applying the IDEF0 methodology to the system is the IDEF0 functional model.
Functional model Is a structural representation of functions, activities, or processes within a modeled system or domain.
The IDEF0 methodology can be used to model a wide range of both automated and non-automated systems.
For systems under design, IDEF0 can be used first to define requirements and functions and then to an implementation that satisfies these requirements and fulfills those functions.
For existing systems, IDEF0 can be used to analyze the functions performed by the system, as well as to account for the mechanisms by which these functions are performed.
Objectives of the IDEF0 standard
The main objectives of the standard are:
document and explain the IDEF0 modeling technique and rules for its use;
provide a means for complete and consistently modeling of system or domain functions, as well as the data and objects that link these functions;
provide a modeling language that is independent of CASE methods or tools, but can be used using these methods and tools;
provide a modeling language that has the following characteristics:
general (generic) - for the analysis of systems and subject areas;
strict and precise (rigorous and precise) - to create correct, usable models);
brief (concise) - to facilitate understanding, communication, stakeholder agreement and verification. (to facilitate understanding, communication, consensus and validation);
abstract (conceptual) - to represent functional requirements independent of physical or organizational implementations;
flexible - to support various phases of the project life cycle.
Severity and precision (Rigor and Precision)
IDEFØ rules require sufficient rigor and precision to satisfy needs without overly constraining the analyst. IDEFØ rules include the following:
control of the details communicated at each level - from three to six functional blocks at each level of decomposition;
bounded Context - there should be no missing or superfluous details that go beyond the established framework;
diagram Interface Connectivity - node numbers, functional blocks, C-numbers and Detail Reference Expression);
data structure cohesion. (Data Structure Connectivity) - ICOM codes and the use of parentheses;
unique labels and titles (Unique Labels and Titles) - no duplicate names;
syntax Rules for Graphics - function blocks and arrows;
data Arrow Branch Constraint - labels for limiting data flows on the branches;
separation of data into Input and Control (Input versus Control Separation - a rule for defining the role of data);
data arrow markings. Data Arrow Label Requirements (minimum labeling rules);
presence of Control (Minimum Control of Function) - all functions must have at least one Control;
purpose and Viewpoint - All models have a goal and point of view statement.
Basic concepts of IDEF0
The methodology is based on four main concepts:
functional block;
interface arc;
decomposition;
glossary.
Functional block (Activity Box) represents some specific function within the considered system.
According to the requirements of the standard, the name of each functional block must be formulated in the verbal mood (for example, "produce services").
In the diagram, the functional block is represented by a rectangle (Fig.). Each of the four sides of a functional block has its own specific meaning (role), while:
the top side is Control;
the left side is set to Input;
the right side is set to Output;
the underside is “Mechanism”.
Figure: Functional block
Interface arc / arrow (Arrow) displays a system element that is processed by a function block or otherwise affects the function represented by this function block. Interface arcs are often called streams or arrows.
With the help of interface arcs, various objects are displayed, to one degree or another determining the processes taking place in the system. These objects can be elements of the real world (parts, cars, employees, etc.) or streams of data and information (documents, data, instructions, etc.).
Depending on which side of the functional block this interface arc is suitable for, it is called “incoming”, “outgoing” or “controlling”.
It should be noted that any functional block, according to the requirements of the standard, must have at least one control interface arc and one outgoing one. This is understandable - each process must follow some rules (displayed by the control arc) and must produce some result (outgoing arc), otherwise it makes no sense to consider it.
The obligatory presence of control interface arcs is one of the main differences of the IDEF0 standard from other methodologies of the DFD (Data Flow Diagram) and WFD (Work Flow Diagram) classes.
Decomposition (Decomposition) is the basic concept of the IDEF0 standard. The decomposition principle is applied when splitting complex process into its constituent functions. In this case, the level of detail of the process is determined directly by the model developer.
Decomposition allows you to gradually and structured represent the system model as a hierarchical structure of individual diagrams, which makes it less congested and easy to digest.
The last of the IDEF0 concepts is glossary (Glossary).
For each of the IDEF0 elements - diagrams, functional blocks, interface arcs - the existing standard implies the creation and maintenance of a set of appropriate definitions, keywords, narratives, etc. that characterize the object displayed by this element.
This set is called glossary and is a description of the essence of this element. The glossary harmoniously complements the graphical language, providing the diagrams with the necessary additional information.
Modeling.The IDEF0 model always starts with the presentation of the system as a whole - a single functional block with interface arcs extending beyond the considered area. Such a diagram with one functional block is called context diagram.
The explanatory text for the context diagram must indicate target (Purpose) constructing the diagram as a short description and fixed point of view (Viewpoint).
Definition and formalization goals development of the IDEF0 model is extremely important. In fact, the goal identifies the relevant areas in the system under study that should be focused on first.
Point of view determines the main direction of development of the model and the level of required detail. A clear fixation of the point of view allows you to unload the model, refusing to detail and study individual elements that are not necessary, based on the chosen point of view on the system.
Related entries:
 How to set up my tele2 unlimited
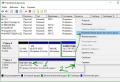 The computer does not see the USB flash drive - the reasons and solutions to the problem
 How to connect the Internet for a day from Tele2?
 What to do if the computer does not see the USB flash drive in Windows
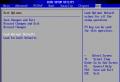 The computer does not see the USB flash drive, what to do


