Information flow in the information system. Information flows of enterprises and methods of their research. Control subsystem composition
Information flows are a set of messages that objectively reflect the development of economic processes that are transmitted through communication channels for management. Streams can be straight (from the control subsystem to the controlled subsystem) and reverse (from the control subsystem to the control subsystem).
The value of information is determined by a complex probabilistic indicator in time P (t) as a function of the probabilities of timely receipt of information P s, its completeness P p and reliability P:
Thus, it is necessary to achieve timely receipt of useful information in sufficient volume. This will ensure quick and efficient decision making.
The decision-making dilemma has traditionally been linked to two limitations.
On the one hand, quickly gathered information in insufficient volume lead to making a decision that is far from rational, right up to an erroneous one.
On the other hand, collecting information for too long can lead to a decrease in the relevance of the very fact of making a decision (up to a complete loss of relevance).
The usefulness (relevance) of information flows shared by the key features shown in Fig. 22.1.

Figure: 22.1. Classification of information flows
The increasing volumes of information flows play a contradictory role. On the one hand, the larger the amount of information, the more opportunity finding a useful part of it for making a decision. On the other hand, according to statistical studies, a twofold increase in the volume of information (i.e., an increase of 100%) is accompanied by an increase in its useful part by no more than 20%. This means that 80% additional information is not useful. In these conditions, the search for effective algorithms for extracting its useful part from the general flow of information for making rational management decisions is of great importance.
A manufacturing enterprise if we consider it from a managerial point of view, consisting of two subsystems, managing and controlled, or subject and object of management, interconnected by information transmission channels. A control object can be conventionally considered as a system that transforms resources, at the input of which raw materials, materials, labor, etc. are received, and the output is the products of production. Information connections of the production system with the external environment can be represented by two input and one output channels.
One of the input information channels receives information from external structures that determine the conditions for the operation of the enterprise, taking into account the plans of production and economic activities, as well as the standards for the use of resources. The combination of this information determines the conditions and affects the technology to achieve the goals of the organization.
The second information input represents the disturbing influences coming from the external environment. An example of disturbing factors are violations of the timing of the supply of raw materials and materials, a decrease in their quality, a change in the conditions for the sale of products, a violation of contractual obligations, by allied enterprises, etc. production systems. For example, equipment breakdowns, accidental violations of technological regimes, illness of employees of the enterprise, etc.
The information output of the production system is a channel for transmitting information to external organizations, for example, an association or ministry, which includes this enterprise or tax authorities, etc. In any control system, the subject and the control object are connected by information channels through which control actions and information about the state of the control object.
The enterprise management body in the classic three-tier version consists of three layers. Information flows circulate inside and outside these layers. From top to bottom - control actions, from bottom to top - feedback information, horizontally - exchange of information between internal objects of the same level, as well as between internal and external objects.
The control mechanism itself includes management personnel, computer networks, financial, information and other resources. The task of production management is reduced to the rational management of resource flows (material, energy, financial, informational, etc.).
Information flow
In logistics, the following are distinguished types of information flows:
1. depending on the type of systems connected by the flow - horizontal and vertical;
2. depending on the place of passage - external and internal;
3. depending on the direction in relation to the logistics system - input and output.
advancing information flow in the opposite direction contains, as a rule, information about the order; forward information flow in the forward direction - these are preliminary messages about the upcoming arrival of the cargo; simultaneously with the material flow, information flows in the forward direction about the quantitative and qualitative parameters of the material flow; following the material flow in the opposite direction, information on the results of the acceptance of goods in terms of quantity or quality, various claims, confirmations.
indicators: and etc.
Currently, in connection with the development of scientific and technological progress, to facilitate the work, it becomes possible to automate the control system information flows... Information flow can be controlled as follows: by changing the direction of the flow; limiting the transmission rate to an appropriate receive rate; limiting the volume of flow to the value of the throughput of an individual node or section of the path.
There is no one-to-one correspondence between MT and IP, i.e. synchronicity in the time of occurrence, orientation, etc. IP can be ahead of the MP (negotiations, contracts, etc.) or lag behind it (information on receiving the delivered goods): outstripping information flow in counter direction contains, as a rule, information about the order; outstripping information flow in direct direction - these are preliminary messages about the upcoming arrival of the cargo; at the same time with the material flow, information goes to direct direction on the quantitative and qualitative parameters of the MP; after behind the material flow in counter information on the results of acceptance of the goods in terms of quantity or quality, various claims, confirmations can pass to the direction.
It is possible that there are several IPs accompanying the MT.
Classification of information flows
It is possible to distinguish elementary, key and supporting information flows that accompany the corresponding operations and functions.
Information flows are divided into:
Internal and external (respectively, circulating within the logistics system or between the logistics system and the external environment);
· Horizontal, referring to one level of the hierarchy of the logistics system, and vertical - from the top link of logistics management to the bottom;
· Input and output - in relation to the logistics system (subsystem or link of the logistics system).
By the type of information carriers, the most common are paper streams (documents), and when using computer technologies for processing information - on magnetic carriers (magnetic tapes, disks), in the form of electronic videograms, etc.
By the time of occurrence of information, regular (stationary) streams are distinguished, corresponding to a time-regulated data transmission, periodic (with a strict time and transmission duration limitation) and operational streams that provide subscribers' communication in interactive and dialogue modes on line and offline.
Depending on the purpose, directive (managerial), regulatory and reference, informational - for accounting and analysis when making decisions - and auxiliary information flows.
In logistics, the following types of information flows are distinguished (Fig. 2.1.):
Figure: 2.1. Types of information flows in logistics
Depending on the type of systems connected by the flow: horizontal and vertical;
Depending on the place of passage: external and internal;
Depending on the direction in relation to the logistics system: input and output.
Processing information circulating in logistics systems is at the heart of the material management process. In this regard, one of the key concepts of logistics is the concept of information flow.
Information flow - is a set of messages necessary for the management and control of logistics operations that circulate both in the system itself and between this system and the external environment. Information flow can exist in the form of paper and electronic documents.
The information flow can be ahead of the material flow, follow simultaneously with it or after it. In this case, the information flow can be directed both in one direction with the material, and in the opposite direction:
· Advancing information flow in the opposite direction contains, as a rule, information about the order;
· Forward information flow in the forward direction - these are preliminary messages about the forthcoming arrival of the cargo;
· Simultaneously with the material flow, there is information in the forward direction about the quantitative and qualitative parameters of the material flow;
· Following the material flow in the opposite direction, information on the results of cargo acceptance in terms of quantity or quality, various claims, confirmations can pass.
The path along which the information flow moves, in the general case, may not coincide with the route of movement of the material flow.
The information flow is characterized by the following indicators: source of occurrence; flow direction; transmission and reception speed; flow rate, etc.
The information flow can be ahead of the material flow, follow simultaneously with it or after it. In this case, the information flow can be directed both in one direction with the material, and in the opposite direction: advancing information flow in the opposite direction contains, as a rule, information about the order; forward information flow - these are preliminary messages about the upcoming cargo arrival; simultaneously with the material flow, information flows in the forward direction about the quantitative and qualitative parameters of the material flow; after the material flow in the opposite direction, information on the results of the acceptance of the goods in terms of quantity or quality, various claims, confirmations.
The path along which the information flow moves, in the general case, may not coincide with the route of the material flow.
The information flow is characterized by the following indicators: source of occurrence; flow direction; transmission and reception speed; flow rate and etc.
The formation of information systems is impossible without the study of flows in the context of certain indicators. For example, it is impossible to solve the problem of equipping a certain workplace with computers without knowing the amount of information passing through it. workplace, as well as without determining the required processing speed.
The information flow can be controlled as follows: by changing the direction of the flow; limiting the transmission rate to an appropriate receive rate; limiting the volume of flow to the value of the throughput of an individual node or section of the path.
Each MT corresponds to some information flow. Information flow (IP) -it is a flow of messages in speech, documentary (paper and electronic) and other forms, generated by the original MT in the considered LAN, between the LAN and the external environment and intended for the implementation of control functions. Table 4.1 shows one of the possible classifications of IP.
Table 2.1. Classification of information flows
| Classification attribute | IP type |
| Attitude to drugs and its links | Internal, external, horizontal, vertical, entrance, exit |
| Type of media | On paper, on magnetic media, optical, digital, electronic |
| Frequency of use | Regular, periodic, operational |
| Purpose of information | Directive (managerial), normative reference, accounting and analytical, auxiliary |
| The degree of openness | Open, closed, secret |
| Data transfer method | By courier, post, telephone, telegraph, teletype, e-mail, fax, over telecommunication networks |
| Information exchange mode | "On-line", "off line" |
| Directivity relative to MP | In the forward direction from the MP, in the opposite direction from the MP |
| Synchronization with MP | Leading, simultaneous, subsequent |
The information flow is measured by the amount of processed or transmitted information per unit of time.
Methods for measuring the amount of information contained in any message are studied in the section of cybernetics, which is called information theory. According to this theory, the so-called binary unit, the bit, is taken as a unit of information. When using electronic computers, information is measured in bytes. A byte is a part of a machine word, usually consisting of 8 bits and used as a whole when processing information in a computer.
Derived units of the amount of information are also used: kilobytes and megabytes.
In the practice of economic activity, information can also be measured: the number of processed or transmitted documents; the total number of document lines in the processed or transmitted documents.
Information flows are the sum of information flows that allows an enterprise to conduct financial and economic activities.
To function normally, an enterprise must receive complete and high-quality information before and after its management makes managerial decisions.
Good information allows an enterprise to:
- - to obtain competitive advantages;
- - reduce financial risk;
- - to determine the attitude of buyers;
- - justify intuitive decisions;
- - to increase the efficiency of activities;
- - monitor the external environment;
- - coordinate strategy;
- - increase confidence in the agreements reached and the commitments made.
One of the most important conditions for the successful functioning of production as a whole is the availability of such a system of information that would make it possible to link together all activities and manage it based on the principles of a single whole.
Information is collected and analyzed using four supporting systems, which together comprise: internal reporting, market research, information analysis, and collection of current external information.
When determining the parameters of the enterprise, financial and accounting statements play a special role. This system of internal reporting displays the indicators of current sales, expenses, quantities of inventories, cash flows, information about receivables and payables.
Continuity of collection is essential for information. This ensures complete clarity in the affairs of your own enterprise, as well as the ability and willingness to provide the market with the right product in the required volumes.
In logistics, types of information flows are distinguished depending on:
- - from the type of systems connected by the flow - horizontal and vertical;
- - from the place of passage - external and internal;
- - from direction in relation to the logistics system - input and output (Fig. 1).
Figure:
Horizontal information flows most often they are informal, they are the most effective from a communicative point of view. They store about 90% of the information. That is, the loss of information during transmission in this way is minimal. This is explained by the fact that people who are at the same level of the service hierarchy find it psychologically easier to understand each other, because they solve similar problems and face similar problems (Fig. 2).

Figure:
Vertical information flows take place between employees or groups of employees at different levels of the hierarchy, for example, between a boss and a subordinate.
In turn, vertical information flows are subdivided into descending (from management to rank-and-file employees in the hierarchy) and ascending (from lower-level employees to higher-level ones) (Fig. 3).

Figure:
External information flows reflect the relationship between the enterprise and economic and political actors operating outside of it. They determine the interaction between the enterprise, its real and potential customers, as well as competitors. The enterprise must constantly monitor the main components of the external environment, which include economic, technological, political and legal, socio-cultural and physical and environmental factors.
Internal information flows - this is the flow of information between various services and levels of the enterprise, for example, a document for the release of materials from a factory warehouse to an enterprise workshop, a document on the release of material resources from one workshop to another, a document on acceptance of finished products, products and parts to the warehouse. Internal information flows clearly characterize the stages of the process: supply, internal production, sales.
The main features of internal information flows are: simplified registration, certified by the signatures of officials, inside individual production units (workshops and sections) often consist of oral messages.
Input information streams is a sequence of documents and data entering the information system for input,
information necessary for solving the problem and located on various media: primary documents, machine media, in memory personal computer... For this purpose, a list of input information and the composition of the requisites of each type of input information, the location of the requisites of the input information, a description of the requisites (fields) of the input documents are compiled.
Output information streams are messages that go beyond one logistic system or one of its subsystems.
The information flow is characterized by the following indicators:
- - source of occurrence;
- - flow direction;
- - transmission and reception speed;
- - flow rate, etc.
The information flow is measured by the amount of processed or transmitted information per unit of time.
Methods for measuring the amount of information contained in a message are studied in a section of cybernetics called information theory. According to this theory, the so-called binary unit, the bit, is taken as a unit of information. When using electronic computers, information is measured in bytes. A byte is a part of a machine word, usually consisting of 8 bits and used as a whole when processing information in a computer.
Derived units of the amount of information are also used: kilobytes and megabytes.
In the practice of economic activity, information can also be measured:
- - the number of processed or transmitted documents;
- - the total number of document lines in the processed or transmitted documents.
It is also necessary to determine the places of collection, input and output of information, forms of its presentation and documentation. To build such systems, it is necessary to use as much as possible modern computer facilities, the possibility of their inclusion in local computer networks and access to international networks, for example, the Internet.
Information flow -this is aggregatecirculating inside the logistics system, between it and the external environment messages,necessary for the management and control of logistics operations.
Organization of information flows is an expensive business. Large sums of money are spent on their formation, transmission, reception, storage, analysis.
Information flows flow in the information space. It is vast and practically covers the entire globe and the developed part of space. The use of this space is not an easy matter, it requires interstate decisions on the use of communication communications on the territory of each country - transport highways (rail, water, air), space communications, telegraph and radio relay lines, etc. The use of these communications (for example, mail delivery to France through the territory of Lithuania, Poland and Germany) is an expensive business.
The creation and maintenance of the material and technical base, ensuring the movement of information flows, is a capital-intensive and lengthy process.
Messages. constituent information flows. are performed on different media.
→ traditional paper documents;
→ electronic documents (magnetic and paper - punched tape, punched cards);
→ oral :,
→ telephone;
→ speech (communication without a telephone).
In logistics, the following are distinguished types of information flows depending on:
→ on the type of systems connected by the flow:
horizontal(information flows covering messages between business partners one level of management:enterprises-suppliers and enterprises-consumers of material resources or between them and their intermediaries in the process of circulation of goods);
vertical(information flows covering messages coming from above,from the governing bodies to their subordinate links of the logistics system: from the holding corporation to subsidiaries, etc.);
→ places of passage:
external(information flows flowing in environment, externalin relation to tologistics system. So, horizontal information flows of messages from partner enterprises (other logistics systems) are external to tothe partner to whom they are sent and who will receive them);
interior(information flows - messages,circulating within one logistics system(enterprises, wholesalers, etc.). For logistic subsystems, message flows inside the subsystem are internal, the rest of messages for nicknames are external);
→ directions in relation to the logistics system:
input(information flows are messages incominginto the logistics system or into one of its subsystems);
output(information flows - messages outgoingbeyond one logistic system or one of its subsystems);
→ urgency
ordinary;
urgent (the corresponding mark "urgent" is indicated on the information carrier and serves as an indicator of the urgency of the message);
very urgent - "lightning" (the corresponding mark "urgent", "lightning" is indicated on the information carrier and serves as an indicator of the urgency of the message);
→ confidentiality (secrecy):
ordinary;
→ significance for information flows of mail messages
simple;
registered (accepted with registration, with the issuance of a receipt for their acceptance to the sender, handed to the addressee against signature. For the timeliness of their delivery, communications organizations monitor more fully than simple messages);
valuable (have the price of compensation, which, in the event of their loss, the communication organization pays the message submitter);
→ transmission rates:
traditional (postal messages);
fast (fax, e-mail, telegraph, teletype, telephone);
→ scope (depending on this, the method of sending messages, the costs of sending them, the order of registration, the language of the message and other features of preparing and sending messages differ):
local;
nonresident;
distant;
international.
An important role among information flows is played by messages of a documentary nature, which are usually drawn up on paper carriers of a certain form, filled in in the prescribed manner and certified by the signatures and seal of the sender of the message. Such messages are called documentary.
2 The information flow is characterized by such indicators. as:
→ source of occurrence;
→ flow direction;
→ transmission and reception speed;
→ flow rate, etc.
Information flows are characterized using the following estimates.
→ by the source of occurrence;
→ direction;
→ volume;
→ periodicity;
→ the order of approval;
→ the order of approval;
→ validity periods;
→ storage order, etc.
Sources of occurrencemessages can be different from the participants in supply chains and related organizations, whose messages affect the movement, organization and acceptance of flows. Such are the messages, for example, from the flood commission about the accident of the bridge and its destruction, which made it impossible to travel along it and require movement along a different route.
Towardsinformation flows can be horizontal (back and forth) and vertical (top to bottom and back). Horizontal messages are called messages between participants in the logistics process of the same level - equal partners. Vertical information flows flow between different levels of management: the top-management and the bottom-subordinate. These are, for example, the messages of the management of the enterprise to the heads of the shops and the answers to them.
The direction of information flow is also interpreted in a different way: as direct and indirect. Direct referral to a partner (manager) or other addressee - to fulfill the requirements of the message. Indirect direction of information flow - sending copies of messages for information, familiarization with this issue, without participating in its solution.
IMPROVEMENT OF INFORMATION FLOWS IN THE CONTROL SYSTEM
1.2. Communication process ................................................ .......................
1.3. Management information support and its composition. Information flows ................................................ .................................................. .............. fourteen
2.METHODICAL ASPECTS OF THE STUDY OF INFORMATION FLOWS ........................................... .................................................. ............... 18
2.1. Information support research methods ........................... 18
2.2. Graphic and matrix methods of information research ............... 21
2.3. Application of CASE-technologies for designing an information system .......................................... .................................................. ............................... 29
3. IMPROVEMENT OF INFORMATION FLOWS IN THE CONTROL SYSTEM OF ELECTROAGREGAT OJSC ...................................... .............. 37
3.1. Diagnostic analysis of information links between functional divisions of the enterprise .......................................... ..............................
3.2. Building a graphical and matrix model of document flow ........
3.3. Justification of directions for improving information flows 43
CONCLUSION ................................................. .................................................. .44
LIST OF USED LITERATURE .............................................. 45
APPENDICES ................................................. .................................................. .46
INTRODUCTION
1 ENTERPRISE MANAGEMENT: SYSTEM PRESENTATION
1.1 Composition of the control subsystem
The analysis of the organization of management is a complex interconnected process of studying the structure and content of the management cycle, the organization of managerial work, information, technical and mathematical support, the composition of bodies and management costs. Analysis is the first step and starting point for any management improvement activity. He lets you give full description elements, structural divisions and levels of the management system, assess their condition and justify the directions of further development. Depending on the goals and objectives set, the analysis can cover different parts of the control system, have a different degree of detail and end with the preparation of various materials, but the methodological basis and the initial positions of the analysis remain the same.
The analysis consists of three interrelated stages of work:
Collecting information about the state of the management organization, its individual elements, processes and objects in the studied and similar industries;
Descriptions of the analyzed process or object using a system of indicators and establishing a connection between them;
Processing the formed system of indicators by various methods and techniques in order to solve the assigned tasks.
Performing the first stage of the analysis is information-generating work. The second stage is associated with the selection of a system of indicators that characterize the studied part of the management organization; development of methods for their measurement and description of their relationships. The third stage of work is performed in different ways, depending on the characteristics of the object being analyzed and the task set for the analysis, with varying degrees of application of qualitative and quantitative methods.
The control process can be viewed statically, that is, as frozen at a specific point in time, and in dynamics (taking into account movement and development).
The analysis of the management organization can be complete (comprehensive) or study some part of the system (thematic analysis); may be global , affecting all major levels and links of management, or local , touching one level or link.
In its complete form, the sequence of the system analysis process includes 9 stages:
I. Formulation of the problem.
II. Research structuring (building a "typical" goal tree).
III. Drawing up a model of a control object.
IV. Forecasting the future state of the control object; risk assessment"
V. Diagnostics of the system and the formation of alternatives for the development of a controlled system.
Vi. Selection of alternatives.
Vii. Implementation of the program of events.
VIII. Development of an information-logical scheme of the control system.
IX. Design and implementation of automated information system procedures into the control system.
The implementation of the first seven stages of the process allows a decision to be made at the top level of management, regardless of whether the enterprise has an automated enterprise management system (ACS). The implementation of the last two stages allows you to automate the collection and processing of information for making standard decisions by middle managers.
I. Formulation of the problem. Before the start of the study, a target is formulated. If managers do not have experience in solving a problem or it cannot be solved using traditional methods, the problem is transferred to the rank of a problem (problematic issue).
II. Research structuring (building a "typical" goal tree). To solve the formulated problem facing the system, it is necessary complex research many issues related to the problematic. But each question, in turn, is related to one or another element of the system. Thus, at this stage, in the most general form, a set of factors is identified that can presumably affect the problem issue under study. Moreover, one group of factors will be related to the external environment, the other - to the competence of the managers of the studied enterprise. As a result, it is necessary to clearly define the range of questions that should be included in the study.
III. Drawing up a model of a control object. The predictive model can be considered as some derivative of the method used in the forecast. To predict the state of economic objects at the enterprise level, models created by the methods of mathematical statistics are quite reliable: trends, piecewise linear relationships, finite differences, production functions (including regressions), as well as expert estimates. When compiling them, reporting and statistical data on the work of the enterprise, the results of questionnaires, indicators of the work of related enterprises are used.
IV. Forecasting the future state of the control object; risk assessment". The models developed at the third stage are used to forecast the most important economic indicators of the enterprise. Most often, at the enterprise level, predictive estimates are used, obtained using trends, regressions, and power-law production functions. It is desirable that the prediction interval does not exceed one third of the interval provided by the reported data. When forecasting, one can also expect qualitative changes in the factors included in the model. An important part of forecasting calculations is to determine the likelihood of their execution (or the "risk of being wrong").
V. Diagnosing the system and forming alternatives for the development of a controlled system (identifying areas for improving production activities and ways to implement them). Diagnosing the states of a controlled system is a crucial stage in the system analysis of the problem. The diagnosis makes it possible to reveal the nature of the dependencies between the parameters of the system and to clarify the factors for achieving goals, to estimate the total amount of reserves in different areas of the enterprise. In the course of the diagnosis "bottlenecks" in the management and production system are revealed, the "organizational and technical level" is characterized. For the diagnosis, in addition to reporting and statistical data, the results of direct interviews with managers of different levels and rank-and-file functionaries and workers, and the results of questionnaires are also used. In some cases, it is advisable to involve statistical information on related enterprises. To clarify the factors for achieving goals and assessing the organizational and technical level, formalized (statistical) methods and methods of expert assessments are used. There are known approaches when the factors are clarified by highlighting the areas of key results in the areas of management activity.
In the case when an automated control system is already functioning at the enterprise and work is underway on its further development (see stages VIII and IX of the system analysis), methods of decision-making by managers (managers) are also studied at the stage of diagnosis.
Vi. Selection of alternatives. From the set of activities formed in the process of diagnosis, mathematical or graphic methods are selected those that meet the external and internal constraints on resources and the criteria for selecting the optimal alternative.
Vii. Implementation of the program of events. For the rational organization of work at the implementation stage, it is necessary:
Publication of the order of the enterprise management on drawing up a development program;
Formation of integrated teams to carry out sections of the program;
Drawing up a network schedule for the implementation of the program;
Organization of a coordination group;
Involvement of employees of research (consulting) organizations to solve the most complex issues;
Inclusion in the coordination group of one of the specialists of the enterprise,
Endowed with great responsibility (this person will perform the functions of "organizer" and "analyst" and ensure the representativeness of the recommendations made by the teams).
If the enterprise has not yet implemented an automated control system, the program includes design work on the automation of control tasks. In cases where the automated control system is already functioning, the development program may contain measures to modernize the automated information system, which will increase the quality and quantity of information about the controlled objects.
VIII. Development of an information-logical scheme of the control system. At this stage, information procedures are determined, with the help of which the values \u200b\u200bof indicators characterizing the state of factors are calculated. First of all, the automated control system includes all tasks in which the values \u200b\u200bof indicators characterizing the factors of the lower level of the goal tree are calculated. All tasks (procedural calculations) are linked (if possible) into a graph; thus, the latter becomes the multilevel information base of the goal tree.
IX. Design and implementation automated system to the control system. The sequence of designing the CAM procedures should be such that the procedures located on upper levels information-logical schemes, were introduced more quickly, since with their help the information used by the procedures at lower levels will be formed. At the same time, it is necessary to take into account the informational interconnectedness of the selected priority tasks with others; the emergence of this factor is due to the fact that when designing an automated information system or improving it, not only the labor intensity and timing of computing work, but also the need to integrate conditionally permanent arrays are taken into account. The point is that some simple (and maybe even economically unprofitable) problems still need to be solved on a computer, since their results are needed for other calculations.
The overwhelming majority of information for the design of ACS procedures is formed at the V and VIII stages of system analysis.
Thus, the quality and speed of designing new CAM procedures will depend on the quality of the diagnosis, thereby accelerating the process of adapting the control system to the changing conditions of the enterprise.
1.2 Communication process
It often happens that the transmitted message is misunderstood and, therefore, the exchange of information is ineffective. John Miner, a distinguished researcher in the field of management, points out that, as a rule, only 50% of attempts to exchange information lead to mutual consent of the communicants. Most often, the reason for such low efficiency lies in forgetting the fact that communication is it is an exchange.
Both sides play an active role during the exchange. The exchange of information occurs only when one side "offers" information, and the other perceives it. To do this, you should pay close attention to the communication process.
Communication process is the exchange of information between two or more people.
The main purpose of the communication process is to ensure understanding of the information being exchanged, i.e. messages. However, the very fact of information exchange does not guarantee the effectiveness of communication between the people involved in the exchange. To better understand the process of information exchange and the conditions for its effectiveness, the following stages of the process should be distinguished, in which two or more people participate.
There are four basic elements in the exchange of information.
1. Sender, person who generates ideas or collects information and communicates it.
2. Message, the actual information encoded using symbols.
3. Channel, a means of transmitting information.
4. Recipient, the person to whom the information is intended and who interprets it.
When exchanging information, the sender and the receiver go through several interrelated stages. Their task is to compose the message and use the channel to convey it in such a way that both parties understand and share the original idea. This is difficult, because each stage is at the same time a point at which the meaning can be distorted or completely lost. These interrelated stages are as follows:
1. The origin of the idea.
2. Encoding and channel selection.
3. Transfer.
These steps are illustrated in appendix 2 as a simple model of the communication process.
Although the entire communication process is often completed in a few seconds, making it difficult to distinguish its stages, it is necessary to analyze these stages to show what problems may arise at different points.
The origin of the idea. Information exchange begins with the formulation of an idea or the selection of information. The sender decides what meaningful idea or message should be exchanged. Unfortunately, many communication attempts are cut off at this first stage because the sender does not spend enough time thinking about the idea.
It is important to remember that the idea has not yet been transformed into words or taken on another such form in which it will serve the exchange of information. The sender has only decided which concept he wants to make the subject of information exchange. To make an exchange effective, it must take many factors into account.
Coding and channel selection. Before conveying an idea, the sender must use symbols to encode it, using words, intonation and gestures (body language) for this. This coding turns an idea into a message.
The sender should also select a channel that is compatible with the type of characters used for encoding. Some well-known channels include the transmission of speech and written material, as well as electronic communications, including computer networks, email, video tapes and video conferencing. If the channel is unsuitable for physical symbols, transmission is not possible. A picture is sometimes worth a thousand words, but not when sending a message over the phone. Likewise, it may not be feasible to talk to all employees at the same time. Aid memos can be sent out ahead of small group meetings to help ensure that the message is understood and the problem communicated.
If the channel is not very consistent with the idea that originated in the first stage, the exchange of information will be less efficient. For example, a manager wants to warn a subordinate about the inadmissibility of serious violations of security measures made by the latter, and does this during a light conversation over a cup of coffee or by sending him a note on the occasion. However, these channels may not be able to convey the idea of \u200b\u200bthe seriousness of the violations as effectively as by formal letter or in a meeting. Likewise, sending a subordinate memo on her exceptional achievement will not convey the idea of \u200b\u200bhow important her contribution is, nor will it be as effective as a direct conversation followed by a formal letter of gratitude as well as an award.
The choice of means of communication should not be limited to a single channel. It is often desirable to use two or more communication media in combination. The process becomes more complicated, since the sender has to establish the sequence of using these means and determine the time intervals in the sequence of information transmission. However, research shows that the simultaneous use of the means of exchange of oral and written information is usually more effective than, say, only the exchange of written information.
Broadcast. In the third step, the sender uses the channel to deliver a message (a coded idea or collection of ideas) to the recipient. It is about the physical transmission of a message, which many people mistake for the communication process itself. At the same time, as we have seen, transmission is only one of the most important stages that must be passed through in order to convey an idea to another person.
Decoding. After the sender sends the message, the receiver decodes it. Decoding - it is the translation of the sender's characters into the recipient's thoughts. If the characters chosen by the sender have exactly the same meaning to the recipient, the latter will know exactly what the sender had in mind when his idea was formulated. If a reaction to the idea is not required, the process of information exchange should end there.
However, for a number of reasons, the recipient can give a slightly different meaning to the message than in the sender's head. From the manager's point of view, the exchange of information should be considered effective if the recipient has demonstrated understanding of the idea by performing the actions that the sender expected of him.
Before talking about the various barriers to communication, it is necessary to reveal two important concepts - feedback and interference.
Feedback. In the presence of feedback, the sender and the recipient change their communicative roles. The original recipient becomes the sender and goes through all the stages of the communication process to transmit its response to the original sender, who now plays the role of recipient.
Feedback can significantly improve the efficiency of management information exchange. According to a number of studies, two-way exchange of information (if there are opportunities for feedback) compared to one-way (there is no feedback), although it proceeds more slowly, nevertheless, it relieves stress more effectively, is more accurate and increases confidence in the correct interpretation of messages.
Noise. Feedback significantly improves the chances of effective communication by allowing both parties to suppress noise. In the language of information transfer theory, noise is what distorts the meaning. Sources of noise that can block communication range from language (verbal or non-verbal), to differences in perception that can change meaning in the encoding and decoding processes, to differences in organizational status between a manager and a subordinate. that can impede the accurate transmission of information.
Certain noises are always present, therefore, at each stage of the information exchange process, a certain distortion of meaning occurs. We usually try to overcome the noise and convey our message. However, high noise levels will definitely lead to a noticeable loss of meaning and can completely block the attempt to establish information exchange. From the point of view of the manager, this should lead to a decrease in the degree of achievement of goals in accordance with the transmitted information. IN appendix 1 the information exchange process is presented as a system with feedback and noise.
1.3 Management information support and its composition. Information flows
The most important feature of the management process is its informational nature. The organization of the implementation of the decisions made is carried out through a system of methods of influencing employees using information about the progress of implementation of the decisions made (feedback). The more accurate and objective the information at the disposal of the control system, the more fully it reflects the actual state and interconnections in the control object, the more justified the goals and real measures aimed at achieving them.
Since the manager in his work relies on information about the state of the object and as a result of his activities creates new command information in order to transfer the controlled object from the actual state to the desired one, then information is conventionally considered the subject and product of managerial labor.
Information as an element of control and a subject of managerial labor should provide a qualitative understanding of the tasks and state of the controlled and control systems and ensure the development of ideal models of their desired state.
In this way, information Support - This is a part of the management system, which is a collection of data on the actual and possible state of the elements of production and the external conditions of the functioning of the production process and on the logic of changes and transformation of production elements.
There are two levels of information support characteristics:
- elemental , i.e. a set of data, characteristics, signs;
- systemic , i.e., reproducing the relationship and dependence between the classification groups of information, implemented in the form of information models.
With the elemental characterization of information, the composition of information, the form and types of media, their nomenclature are studied.
Basic requirements for the quality of information:
Timeliness;
Reliability (with a certain probability);
Adequacy;
Reliability (with a certain degree of risk);
The completeness of the information system (on the quality and resource intensity of the goods, conditions for the stages life cycle products of the company and competitors, etc.);
Targeting;
Legal correctness of information;
Reusability;
High speed of collection, processing and transfer;
Encoding capability;
Relevance of information.
When characterizing an information system, the movement of information flows, their intensity and stability, algorithms for converting information and a workflow scheme corresponding to these objective conditions are investigated.
Solutions are ideal descriptions of the desired state of an object and how to achieve that state. They are a product of limited use, as they are aimed at a specific object under clearly described conditions. The quality of the solution as a finished product manifests itself indirectly, in the activity of the object to which the solution is directed.
When creating information support, they are guided by the average, leveled need for information of managers and specialists [see. pr. 7]. A special place here is occupied by information about management, which reflects progressive techniques and methods of organizing management.
In the process of organizing information, it is of fundamental importance to divide it into conditionally permanent acting as a normative reference, and variable ... Both of these types of information, based on the analysis of classification links, are organized into interconnected blocks (models), which can be descriptive, i.e., characterizing the process in statics or dynamics, components that reflect a certain typical situation.
The process of forming information support includes several stages:
Description of the state of the object, i.e. a physical photograph. This presupposes a set of technical and economic indicators and parameters that characterize the control and controlled systems, with the appropriate classification of these indicators;
Modeling of classification relationships in information arrays with the allocation of cause-and-effect relationships, i.e. the formation of private static models;
Reflection in information models of the dynamics of individual elements and processes, i.e., substantiation of trends in quantitative and qualitative changes in production. At the same time, a quantitative change presupposes the correction of information, and a qualitative change presupposes its partial or complete reorganization;
An integrated information model of the production process, reflecting the relationship and dynamics of local processes and the entire production.
The order of formation determines the approach to the analysis of the composition of information. The organization of information largely determines the order of its storage, registration, updating, transmission and use. A clear organization of data banks makes it possible to more fully substantiate the directions of movement, the intensity of flows, the patterns of its transformation, the methodology of requests and receiving.
Thus, an information support system is a collection of data on the goals, state, directions of development of an object and its environment, organized in interconnected streams of information. This system includes methods of obtaining, storing, searching, processing data and issuing them to the user.
2 METHODOLOGICAL ASPECTS OF THE STUDY OF INFORMATION FLOWS
2.1 Research methods of information support
The implementation of the requirements for the analysis of the management organization largely depends on the quality and volume of information about the state of the analyzed object. The information should be necessary and sufficient to objectively characterize the management organization using quantitatively defined characteristics.
The main sources of information about the established management organization and trends in its development are currently the following.
The first source is reporting data and current year. This source makes it possible to identify the number and composition of workers employed in the management apparatus, the amount of management costs, the cost of organizational and computer technology.
The second source - study of directive documentation (orders, instructions, minutes of meetings, materials for checking execution, reports of individual departments, etc.) .
Third source - special examinations. This source is currently the main one.
Data is gaining importance now on the workload of the material elements of the control system. The object of observation in this case is a separate object - a computer, a duplicating machine, or any document.
An important source of data on the organization of management is conducting special surveys employees of the management apparatus or team of the corresponding division of the managed object.
The named sources of information are not mutually exclusive. They should be combined, complementing and enriching the material obtained by different methods.
Currently, several methods for analyzing information support are successfully used. They differ in the accepted characteristics of the amount of information (symbols, records, graph lines, documents, etc.), methods and analysis tools. The most developed are the following methods.
1) The method of matrix modeling of data development processes, tested at machine-building enterprises.
2) A graphic-analytical method for studying information flows, tested at metallurgical plants.
3) Description of information flows in the form of a tree-type graph.
4) Method of schemes of informational connections of planned calculations.
5) The method of research analysis of management problems, developed on the identification of "short" flows.
These methods are based primarily on the general quantitative characteristics of information.
Each of these methods has its own field of application: some are convenient for describing information links between departments, others between groups of tasks, individual tasks and groups of elementary procedures.
The most complete and detailed reflection and analysis of information flows can be obtained using information models, which are developed as matrix models ... At the same time, various matrices are used - material processes and workflow, workflow and the composition of solutions and tasks at a specific management level, for certain groups of tasks, for different management levels, etc.
The most commonly used models are in the form of matrices and graphs. Both of these modeling methods involve the selection in information system in the form of independent components of initial, intermediate and final data. This allows them to be studied in isolation, which is of fundamental importance for the study of the need for external and internal production information.
Matrix models of circulating information flows can be built in various versions, but matrices of dimensions “document per document”, “indicator per indicator” are used as the basic ones. In this case, documents can be viewed as single blocks.
In the classical form, matrix models are intended for the analysis of classification links. But they are also acceptable for studying the main characteristics of the information support of the administrative apparatus, because they allow showing various groupings of types and sources of information and contribute to a more complete identification of the actual provision and the possibility of improving tasks of different types.
Graphic-analytical method research of information flows is based on the representation of their information graph and analysis of its adjacency matrix. Graphs can be built at the document level, at the component level (input, intermediate and external data) and at the synthetic level (input and intermediate data, external and functional results).
On the basis of graphic-analytical models, it is possible to identify the number of varieties of initial, intermediate and effective information used and obtained in the process of solving the problem, the frequency of using various information data, the actual use of each indicator in the work.
Having the graphs of the main tasks and procedures solved in the management process, it is possible to obtain an adjacency matrix of graphs showing the relationship of tasks and documents used in management. The graph of each task and a specific level of management makes it possible to establish rational information continuity, the possibility of using intermediate and final results of a given task for others.
Structural graph can be used to calculate the amount of information.
These methods of analysis of information support in the aggregate allow considering all aspects of the semantic aspect of analysis.
2.2 Graphic and matrix methods of information research
The most complete analysis of information support can be carried out when constructing and analyzing a block diagram of information carriers in the form of an information graph.
When justifying information flows, it is necessary to take into account:
The movement of information within the framework of the information support itself (from block to block);
Interrelation and continuity of information in technological procedures of one functional subsystem and between independent functional units;
Hierarchical orientation of information movement;
Direction and types of output information design.
For this purpose, information models of objects and processes occurring in them are successfully used. ACS creates an opportunity to move from building information models for individual functions and controls to building an information model of management as a whole and for the enterprise.
The procedure for preparing for the solution of a group of problems or a separate problem presupposes a preliminary determination of the composition, sequence and interrelation of the structural components of information flows that provide the solution process. The structural components of the flow include input and output documents (functional level of analysis), arrays of input, intermediate and output information (elemental level of analysis), considering the selected levels independently or integrating them into a single scheme.
For information flows fixed in composition and content in the automation object, constant composition and interaction of ACS elements and task algorithms, the structure of information flows in the system will generally remain unchanged. The sequences and relationships of the defined structural components of flows are constant and can be found once. To automate the process of analyzing information flows, it is necessary to create an appropriate information model. For this purpose, it is convenient to use the apparatus of graph theory.
Let us represent the structural components of information flows in the form of vertices of an oriented graph G \u003d (M, V), the arcs of which reflect their connections with each other. Each pair of vertices Mi and Mj is connected by an arc directed from Mi to Mj only if there is a transition of information from Mi to Mj.
Using the properties of the graphs, one can obtain the series important characteristics investigated flows of information in the system.
Let us form the power adjacency matrices R, R 2,…, R N and the sum matrix. Matrix analysis allows setting the following properties of streams. The order of the component Mj is determined by the longest path length connecting Mi to Mj. It is equal to the degree n of the adjacency matrix R n at which. The maximum value of the order of the component Mj is determined by the longest path from Mi to Mj for the entire information graph. The initial data is selected when the sum of the elements of the j column of the adjacency matrix is \u200b\u200bzero. If the sum of the i elements of the row is equal to zero, the output is highlighted. The values \u200b\u200band are equal to the number of components, respectively, included in Mj, and the number of results, which include Mi. The element r ij of the adjacency matrix of degree n is equal to the number of paths of length n connecting Mi and Mj. The elements r ij of the matrix R sum give the total number of all paths from Mi to Mj without specifying the path length.
Elements of the j column that are not equal to zero of the matrix R sum, not equal to zero, make it possible to identify all the components that form Mj on all data paths. Non-zero elements i of the row indicate the results in the formation of which the element Mi is used.
Using the adjacency matrix R and the order value, you can determine the storage duration of the components that are intermediate to the output.
The algorithm for analyzing information flows is presented in general form in Appendix 9. By modifying the algorithm, it is possible to obtain practically all the characteristics of the interaction of elements in the ACS model. A fragment of a real model illustrating the volume and complexity of the interconnections of the system elements is given in Appendix 10. For clarity, it includes only separate arrays of information and functional tasks. For this reason, the fragment highlights some of the most significant connections between elements in terms of input and output information.
Information graphs and their corresponding adjacency matrices can be used to determine the amount of information on tasks, task groups, subsystems, the system as a whole, and on any other structural components of the graph.
As shown above, the volumes of data entered into the system are quite large, therefore their efficient organization at the machine level is relevant. It is convenient to analyze information to obtain initial data for the purpose of constructing or reconstructing the created information fund on the considered graph model within the framework of a single analysis algorithm. It is recommended to analyze the following relationships:
Identify the number of tasks that use this indicator. Based on this information, the coefficient of data duplication is calculated in the case of organizing separate arrays with initial data for each task;
Calculate the matrix of the joint occurrence of pairs of indicators in tasks, the elements of which show the number of tasks in which the corresponding indicators are used together. Such indicators can be combined and used in a common information array of a single information fund;
Determine the number and list of targets in which this indicator is found together with other indicators, as well as the number and list of indicators. This will allow you to identify groups of indicators that are used only together and are not used separately in any task.
The process of grouping indicators by tasks can be formalized by introducing the coefficient of communication between groups. The coupling coefficient is calculated using the following formula:
![]()
Financial department - enters - 35 forms, exits - 34 forms of documents, which is 13% at the entrance and 12.7% at the exit;
Planning and Economic Department - includes - 32 forms, exits - 32 forms, which is 12% at the entrance and 12% at the exit;
Marketing department - enters - 44 forms, exits - 41 forms, which is 16% at the entrance and 15% at the exit;
Production and dispatch department - 31 forms are included, 22 forms come out, which is 12% at the entrance and 8% at the exit.
The flow charts of documents in these departments are presented in application.
Thus, it can be seen that at the entrance to the departments, information flows are more loaded than at the exit. This indicates that functional units process the incoming information, possibly simplifying it. In order to track how the departments process and use the information coming to them in more detail, we investigate the information flows in the planning and economic department.
3.2 Building a graphical and matrix model of document flow
The document management system at the enterprise is a reflection of its production and economic activities. As production improves, the workflow changes. This change is expressed in the emergence of new (or elimination of existing) forms of documents and a change in the routes of their movement.
To analyze the data processing system, it seems appropriate to divide all documents circulating at the enterprise into three main groups: planned, actual (reporting), and regulatory.
Matrix model (see Attachment) the flow of information in the planning and economic department of Electroagregat OJSC according to the forms of documents shows that the main activity of the unit in this business process related to planning is aimed at developing basic documents that are transferred to the financial department and accounting department, external relations department, OOTiZ and ОИХиО.
For example, the financial department receives - 4 forms of planning documents, the accounting department - 3, the external relations department - 3, the OOTiZ - 3, and the IHiO - 3 forms of documents.
To conduct a more detailed analysis of the workflow for PEO, it is necessary on the basis of the Matrix of document flow in the business process from the conclusion of the contract to the sale of products see Attachment build table of movement information see Attachment .
Although there are close relationships between departments, which complicate (confuse) the process of flow of documents when solving problems, nevertheless, the main flow of data comes from the PEO to the finance department. It is important to note that it is necessary to have not only links between functional units, but also the so-called feedbacks... This is due to the following factors:
Isolation of divisions in solving planning and economic problems;
Decentralized use of standards for solving problems of various levels of planning.
This leads to the fact that in the process of functioning, each department has to solve planned tasks. However, the main tasks of the enterprise are determined by the production plan for the year and the production plan for the month.
To develop and approve the production plan, the PEO provides information:
Marketing and Sales Department (UMiS) - draft nomenclature production plan,
Technical management (TU) - draft plans for reconstruction and technical re-equipment, preparation of production and the development of new and modernized types of products; technical re-equipment and purchase of equipment; environmental protection; estimates for energy consumption, wastewater disposal, communication services and equipment repair,
Quality management (QM) - cost estimates for licensing and certification of products and QM,
Human Resources and Regime Office (HRMD) - estimates of costs for technical training and costs for maintaining VOKhR,
Capital Construction Department (OKS) - draft capital construction and renovation plan.
Annual and monthly production plan is provided:
Executive Directorate (ID),
Technical management (TU),
Production management (PU),
Marketing and Sales Department (UMiS),
Financial and economic management (FEU).
The scheme of work execution during the development and approval of the production plan is presented in annex .
In the process of developing and approving the production plan, 13 forms of documents are used, which are supplied by the functional units and services named above.
Documents used in the development of the production plan:
Production plan draft,
Development plan for new and upgraded products,
Reconstruction plan, technical re-equipment and equipment purchase,
Help on planning costs for environmental protection by the Department of OHS,
Estimated costs for energy, water disposal, communication services, equipment repair by contracting authorities,
Plan of estimated costs for certification of works,
Cost estimate for vocational and technical training of personnel at the head plant of JSC Electroagregat,
Cost estimate for the maintenance of VOKhR,
Draft plan for capital construction and repair of buildings and structures,
Plan for the main technical and economic indicators,
Draft plan (monthly),
The price of a product from competitors' factories.
3.3 Justification of directions for improving information flows
For a more detailed analysis of information flows in the PEO department, we calculate the coefficient of continuity of information flows for drawing up a monthly production plan.
Coefficient of continuity of information flows (1), where t c.nor, t c.fact - the duration of the management cycle, calculated by the time of passage of the document, standard and actual.
The monthly production plan must be drawn up by the 25th day of the month preceding the planned month. However, in practice, certain difficulties arise when developing the next production plan. For example, decisions of higher organizations.
By nur for January \u003d 30days / 34days \u003d 0.89,
By the way for February \u003d 31days / 35days \u003d 0.89,
By noon for March \u003d 31days / 35days \u003d 0.89,
By noor for April \u003d 31days / 32days \u003d 0.97.
K nur for I quarter \u003d (0.89 * 3 + 0.97) /4\u003d0.91.
Based on a certain coefficient of continuity of information flows for each month, it can be seen that it is more or less stable for the first three months, although it is close to 1, but not equal. This is generally a favorable trend, since the information flow is continuous, although PEO, as you can see, is late with the adoption of the production plan for the next month (). However, already in April, the plan was adopted only 1 day later than expected. This suggests that, perhaps, since the beginning of the year, some changes were made to the methodology for drawing up a plan, which caused difficulties for 3 months. But these issues were successfully resolved. In general, for the quarter, the coefficient of continuity of information flows is quite acceptable.
Management efficiency factor
 (2), where -
D 1, D 2, D 3 - the set deadline for the relevant documents;
K 1, K 2, K 3 - lag behind the accepted deadline for the execution of documents in days;
d 1, d 2, d 3 - the proportion of documents of a particular type.
For the year, 13 forms of documents are developed per year to draw up the annual plan. Frequency of filling out documents ![]() (3), where D is the number of documents developed for drawing up an annual production plan per year; d ij - the number of the i-th document of the j-th periodicity, developed for the period; n j is the number of periods in a year. Thus, the number of documents developed for drawing up a production plan is 13.
(3), where D is the number of documents developed for drawing up an annual production plan per year; d ij - the number of the i-th document of the j-th periodicity, developed for the period; n j is the number of periods in a year. Thus, the number of documents developed for drawing up a production plan is 13.
Related entries:
 Presentation on the topic "social structure and social relations" Social stratification by Weber
 The rapid development and expansion of the fields of application of electronic devices is due to the improvement of the element base, - presentation
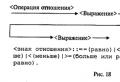 Boolean values, operations, expressions
 Von Neumann architecture presentation
 The history of the development of computer technology The beginning of the computer era


